Aluminum Looks Like a Bad Mirror Until You Compare It Fairly
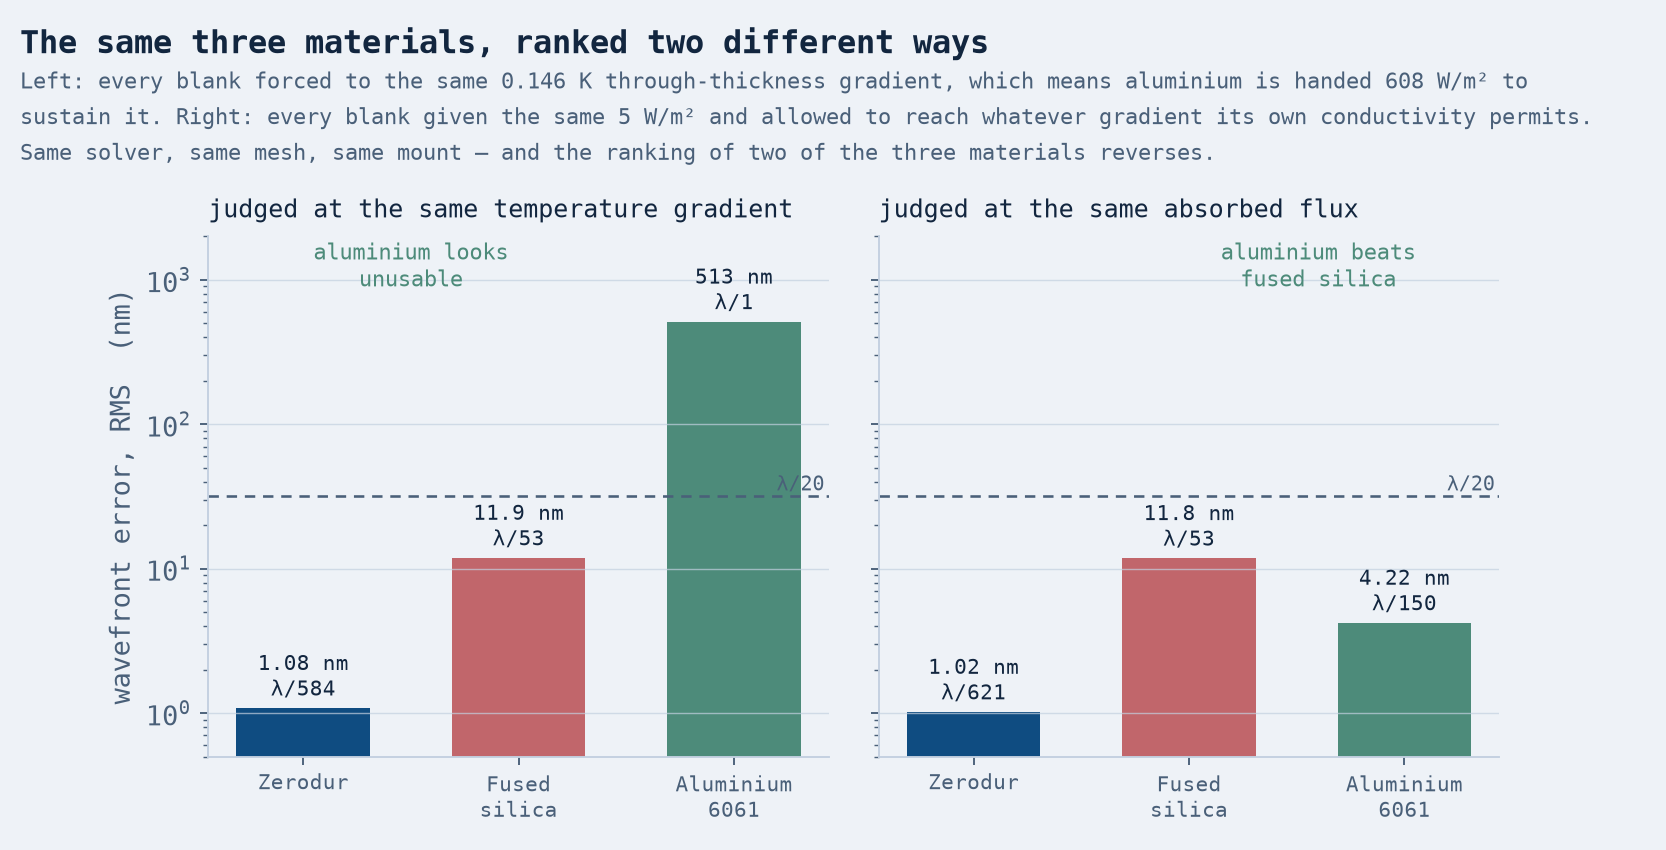
Put a 300 mm telescope mirror somewhere one face sees the sun and the other sees deep space, and it stops being flat. The interesting part is not how much — it is that the answer depends entirely on how you set up the comparison. Judge three candidate materials at the same temperature gradient and aluminum is 474 times worse than Zerodur, an absurd choice. Judge them at the same absorbed heat, which is what an orbit actually delivers, and aluminum beats fused silica by almost three to one. Same solver, same mesh, same mount. Only the question changed.
The trap, found before a solver ran
The obvious way to compare mirror materials is to pick a temperature difference — say a tenth of a kelvin across the blank — and see how much each one bends. Thermal bending curvature is κ = αΔT/t, so at fixed ΔT the answer is just the coefficient of thermal expansion. Zerodur's is about 0.05 × 10⁻⁶/K. Aluminum's is 23.6. That is a factor of 472 before you have done anything else, and it is the number that makes people stop considering metal mirrors.
But nothing in space hands a mirror a temperature gradient. It hands it a heat flux, and the gradient that results is the material's own business: ΔT = q·t/k. A material with high conductivity simply refuses to sustain much of a gradient. Substitute that in and the curvature becomes κ = αq/k — the expansion coefficient divided by the conductivity. Which is exactly why α/k is the standard figure of merit for this problem, and exactly the thing the fixed-ΔT comparison throws away.
Aluminum's conductivity is 167 W/m·K against fused silica's 1.38. It expands 43 times more per kelvin and it experiences 121 times fewer kelvin. So we solved it both ways, properly, rather than arguing about it.
The gradient is smaller than you would guess
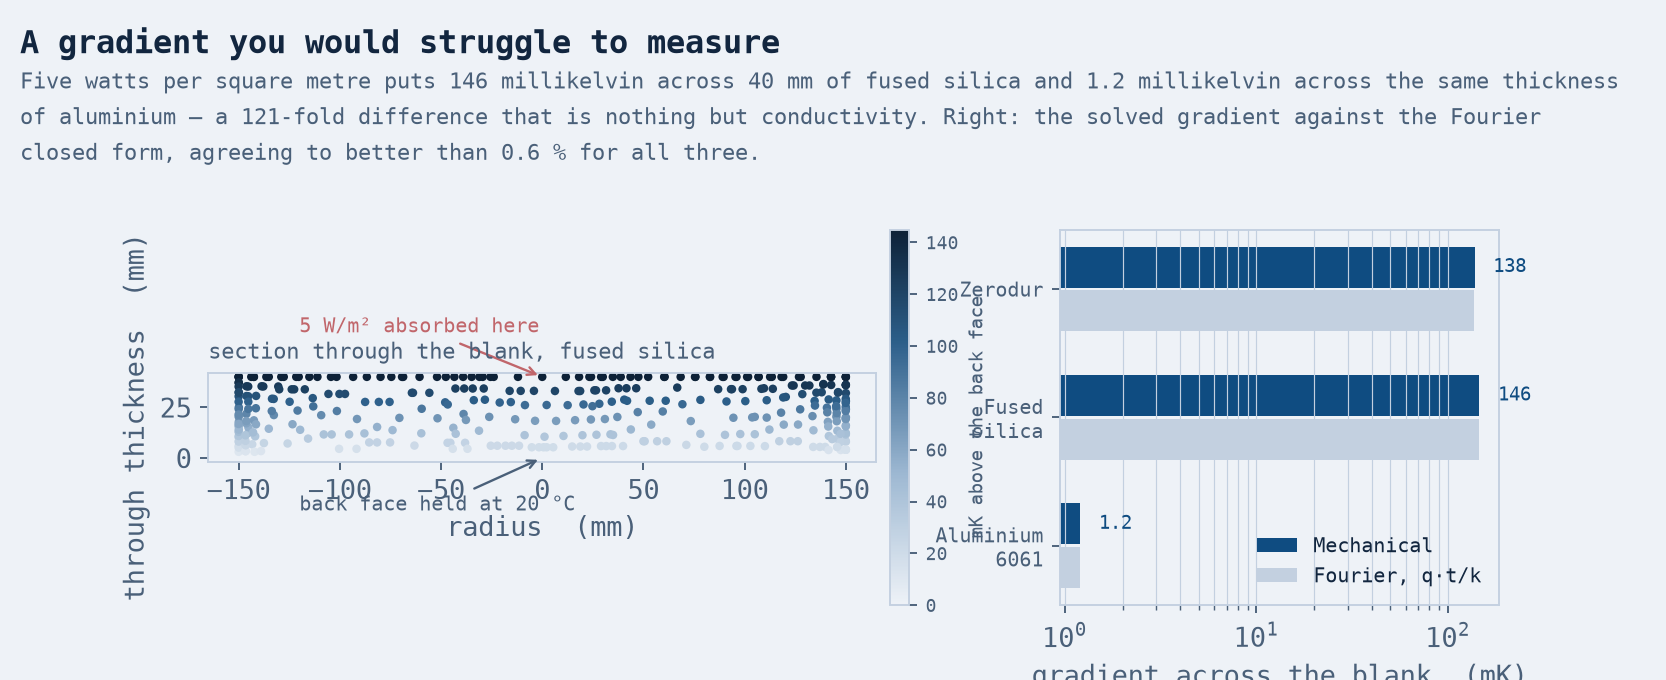
Five watts per square meter is a modest asymmetry — earthshine on one side of a baffle, a warm electronics box in the wrong place. Across 40 mm of fused silica it produces 146 millikelvin. Across the same thickness of aluminum it produces 1.2 millikelvin. That is not a small effect being modeled sloppily; it is the entire mechanism. Conductivity is doing all the work, and it is why the two framings disagree.
What the mirror actually does
The temperature field goes straight into a coupled-field static solve, which computes the temperature and the displacement in the same element formulation rather than mapping one onto the other. The mirror sits on three kinematic pads — one fixed, two constrained only out of plane. That mount matters more than it sounds: clamping the back face would manufacture a stiffness that fights the expansion and would report a flatter mirror than the hardware will ever be.
Two things then have to happen before the displacement field is an optical number. Only the optical face counts — the back and the rim move too and none of it reaches the beam. And piston and tilt come out: a mirror that shifts bodily or tips as a rigid body has lost no figure at all, the telescope simply re-points. On a three-point mount those are the largest terms in the field, and leaving them in would inflate the answer several-fold.
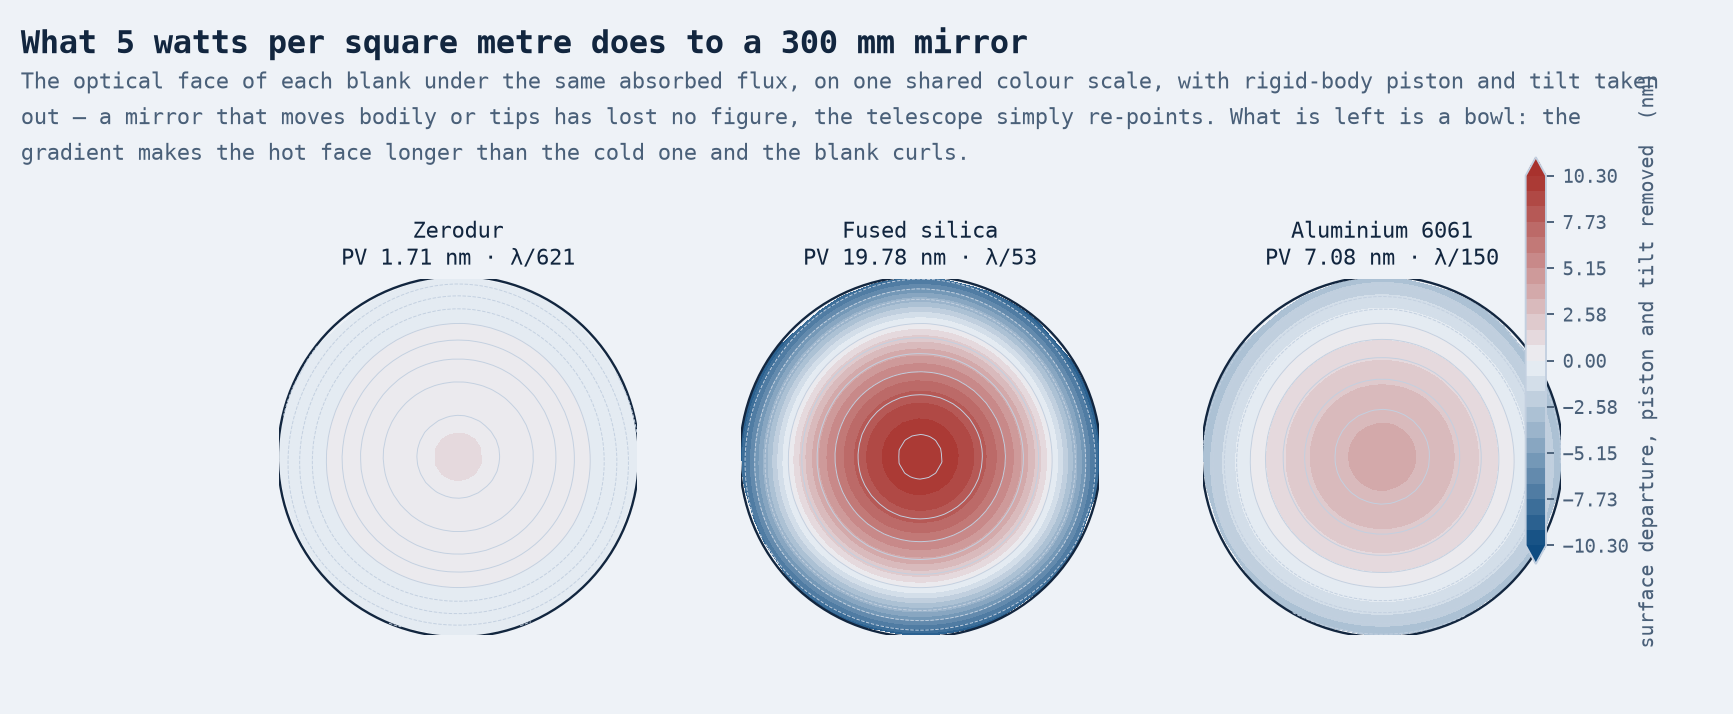
The surface departure doubles on reflection, so a 10 nm bowl is a 20 nm wavefront error, and that is the number an optical designer budgets against.
It is all one aberration, and that is good news
Fitting Zernike polynomials to the deformed surface shows something worth acting on: defocus is two to three orders of magnitude larger than every other term, for all three materials. The blank curls into a bowl and essentially nothing else happens.
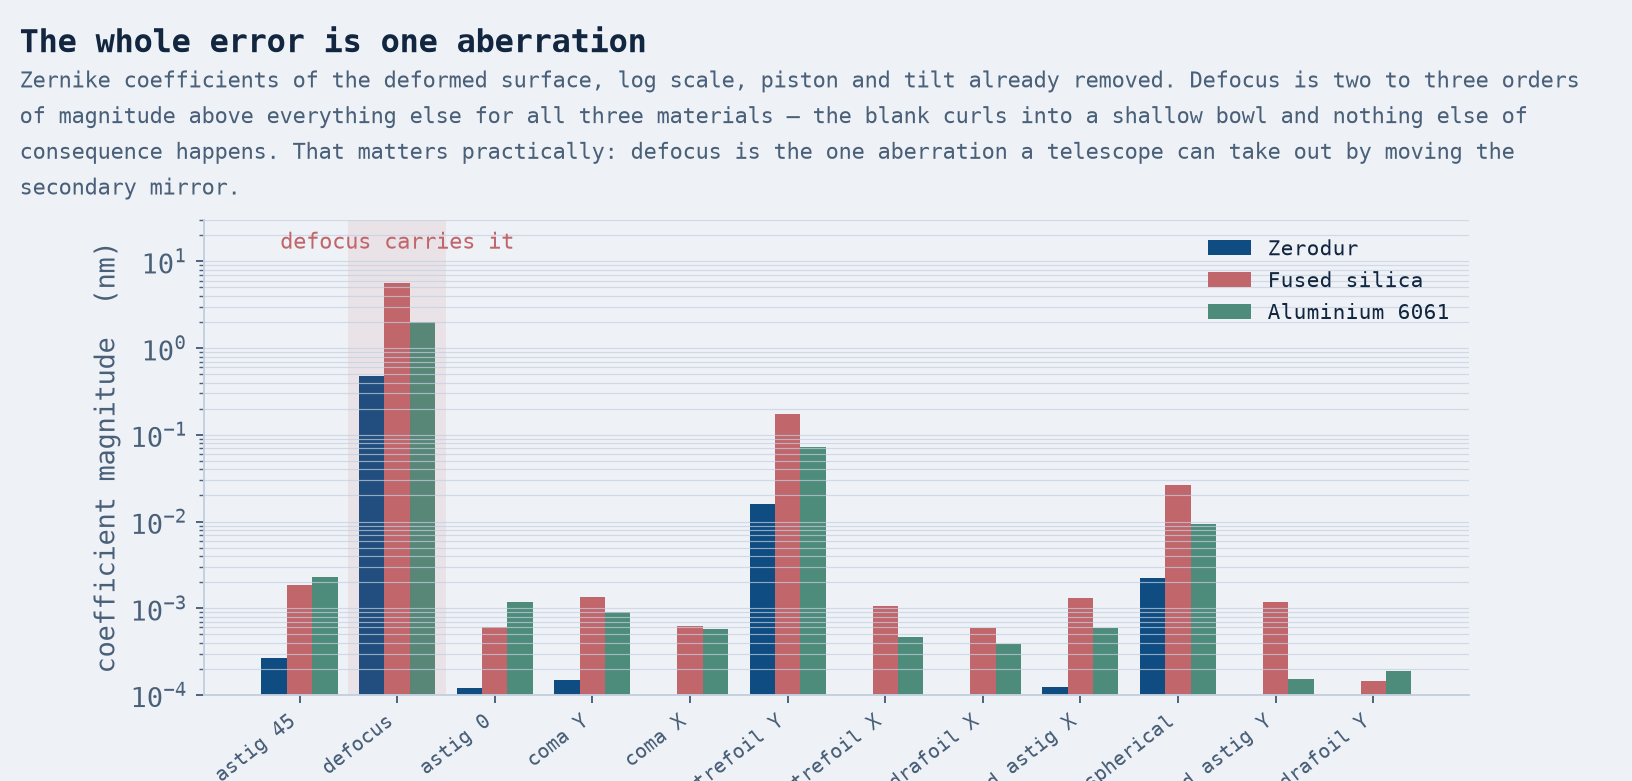
This is a practically useful result rather than a curiosity. Defocus is the one aberration a telescope can remove — move the secondary mirror a few microns and it is gone. A thermal distortion that is 99 % defocus is largely correctable; the same amount of error spread across astigmatism and trefoil would not be. Two mirrors with identical RMS wavefront error can therefore have very different operational consequences, and a study that reports only the RMS cannot tell you which one you have.
Two routes to the same wavefront
The wavefront error was computed twice from the same displacement field by different arithmetic. Route one takes the RMS of the residual surface departure directly. Route two fits fifteen Zernike terms, drops piston and tilt, and rebuilds the surface from the remaining coefficients. The two agree to 0.6 %.
There is a third number worth mentioning because it does not agree. The root-sum-square of the Zernike coefficients — the textbook shortcut, valid because the polynomials are orthonormal — comes out 5.4 % low, identically for all three materials. That identity assumes the wavefront is sampled uniformly across the disc, and a finite element mesh is not uniformly sampled. It is a small thing and it does not change any conclusion, but it is the sort of 5 % that quietly becomes someone's error budget, so it is reported rather than smoothed over.
One curve converges and one does not
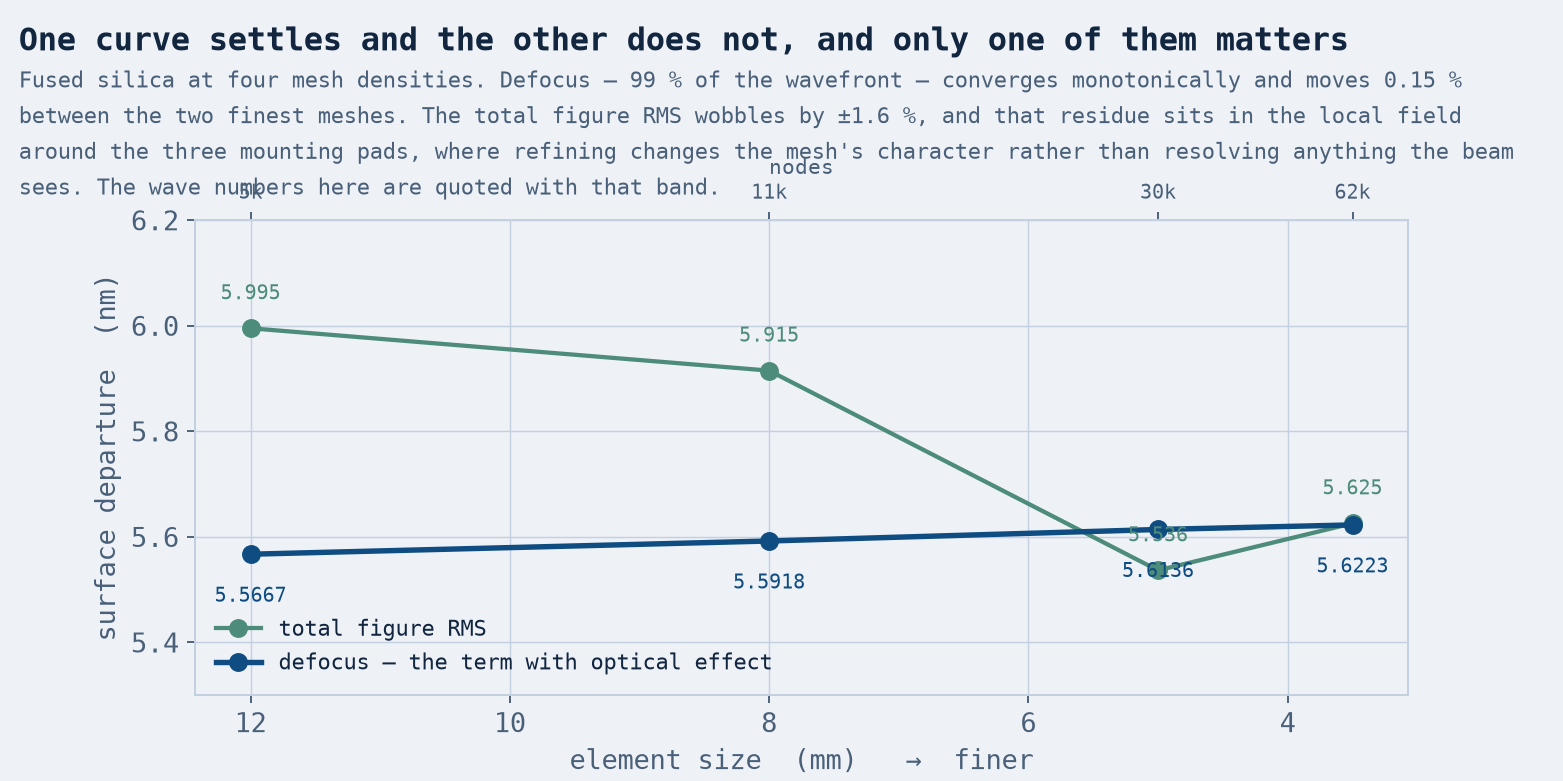
No wave number is worth quoting until the mesh has stopped changing it, so the silica case — the worst in the set — was solved at four densities from 4.7 thousand to 62 thousand nodes.
The defocus coefficient converges cleanly and monotonically: 5.567, 5.592, 5.614, 5.622 nm, moving 0.15 % between the two finest meshes. The total figure RMS does not — it wobbles by about ±1.6 % and does not settle. Locating that residue explains it: it lives in the small region around the three mounting pads, where refining the mesh changes its character rather than resolving anything. The beam does not care about it, and the quantity the beam does care about is converged.
How much heat can it take?
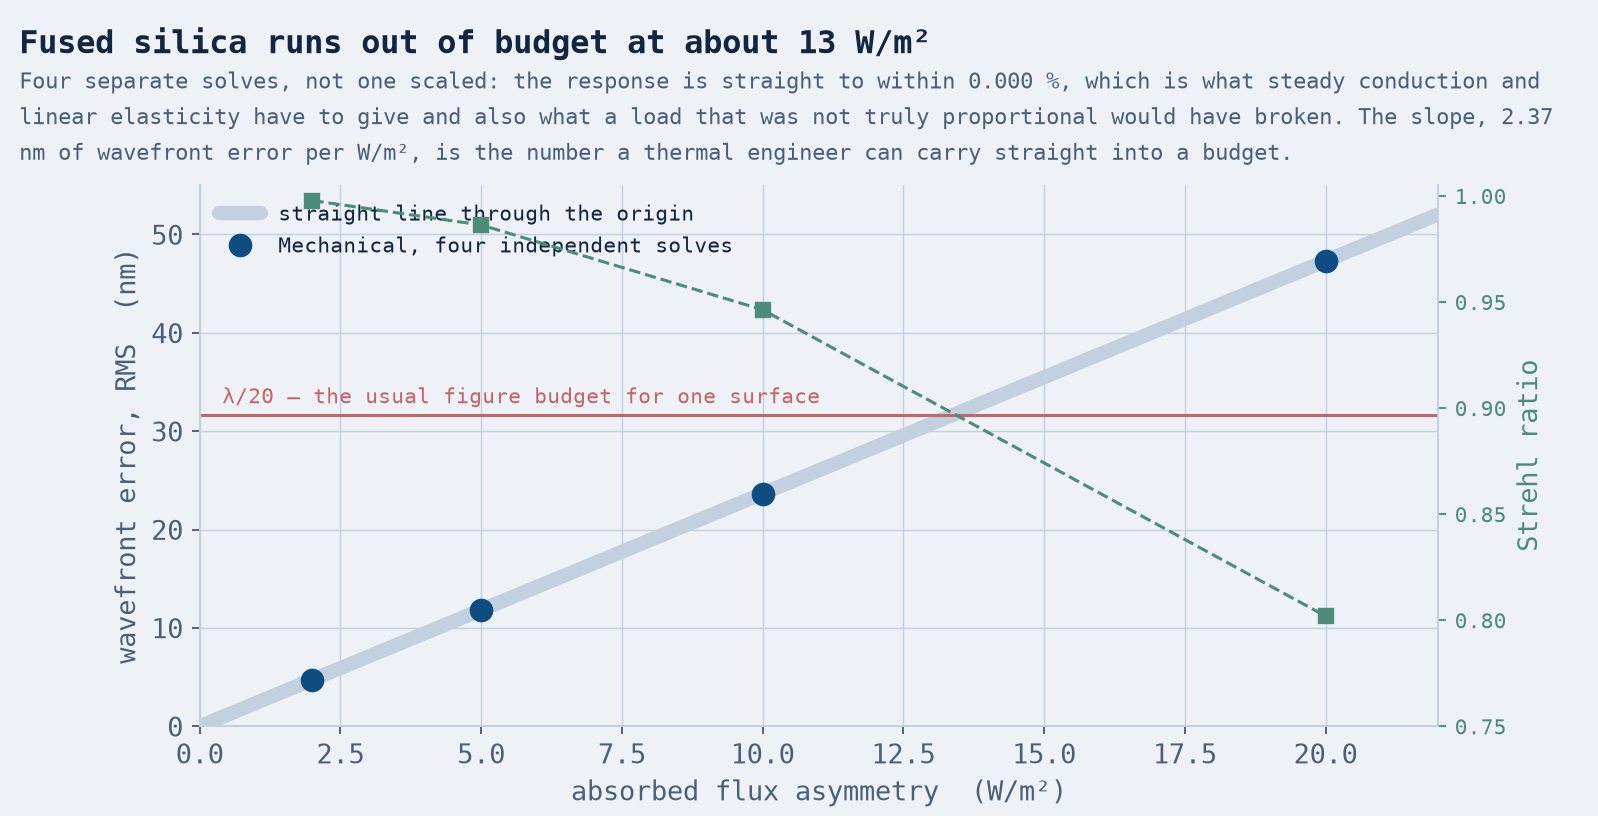
Steady conduction and linear elasticity are both linear in the load, so the wavefront error must be proportional to the absorbed flux. Must-be is a weak reason to believe something, though, and a boundary condition that is not truly proportional would hide behind exactly that reasoning — so it was solved four times instead of once and scaled.
What this is actually for
The temptation with a material comparison is to run it once, read off the ranking, and move on. This one inverts depending on a modeling choice made in the first thirty seconds, and both versions of the calculation are arithmetically correct. The fixed-gradient comparison is not a mistake in algebra; it is a mistake about what the environment does.
That generalizes past mirrors. Any time a comparison is normalized on an intermediate quantity — a temperature, a deflection, a pressure drop — rather than on the thing the environment actually imposes, the normalization is quietly choosing the winner. The value of running it as a full structural-thermal-optical chain is not the nanometers at the end. It is that the chain forces the input to be a real boundary condition, and a real boundary condition cannot be normalized away.
None of which makes aluminum the right answer. It has a coefficient a hundred times more sensitive to a soak temperature change, it will not hold a polish like glass, and a real design would be lightweighted, coated, and mounted on flexures that bring their own distortion. What it does mean is that ruling it out on a fixed-ΔT comparison rules it out for a reason that is not physically there.
Part 2 — then the sun comes up: one full day on the mirror
Choosing the mirror material is question one. Question two arrives every morning: park that telescope outdoors and the sun crosses the sky for eleven hours, heating it from a direction that never stops moving. Same structural-thermal-optical toolchain, now marched through a whole day — here is what the daylight actually does to the image.
This is a companion to our STOP telescope study. That one applied a uniform absorbed flux and found the wavefront error was essentially pure defocus. Here we changed one thing: the sun moves. Over a day the thermal load arrives from a direction that sweeps across the sky, so the figure error the mirror bends into the beam is no longer symmetric — and the interesting question is what survives an hourly refocus.
Why a mirror cares what time it is
A telescope mirror is a slab of glass trying to hold a shape measured in nanometers while the world around it changes temperature. Sunlight — direct, scattered, or reflected off the structure — lands on it unevenly, and glass expands where it is warm. The base study showed that a uniform warming bends the mirror into a bowl: pure defocus, which a telescope corrects by nudging the secondary mirror a few microns. It is the aberration observatories least fear, because it is the one they can chase in real time.
But the sun is never uniform. In the morning it loads one side of the optic; at noon it is high and nearly symmetric; by evening it loads the other side. That rotating, one-sided warming is what this study turns into numbers — and it is where the aberrations a telescope cannot simply refocus come from.
Letting the day run
The workflow is the point. The base study’s validated STOP chain — a coupled thermal-structural solve on a three-point kinematic mount, then a Zernike decomposition of the deformed face — was reused verbatim. The only change is the load: instead of a uniform flux, each hour gets a directional one, a uniform part plus a gradient pointing at the sun’s azimuth, with the total scaled by the sun’s height. A solar-geometry model set the sun’s position for a mid-latitude day (34°), and a script solved every daylight hour unattended, refocusing each result in software afterward.
That is the everyday value of scripting a solver: one validated case becomes a whole day. No single solve can tell you when the telescope is worst, or whether the leftover error repeats predictably enough to correct ahead of time. The swept day answers both, and it costs a loop around a solve that already had the physics right.
Defocus you can fix; coma you cannot
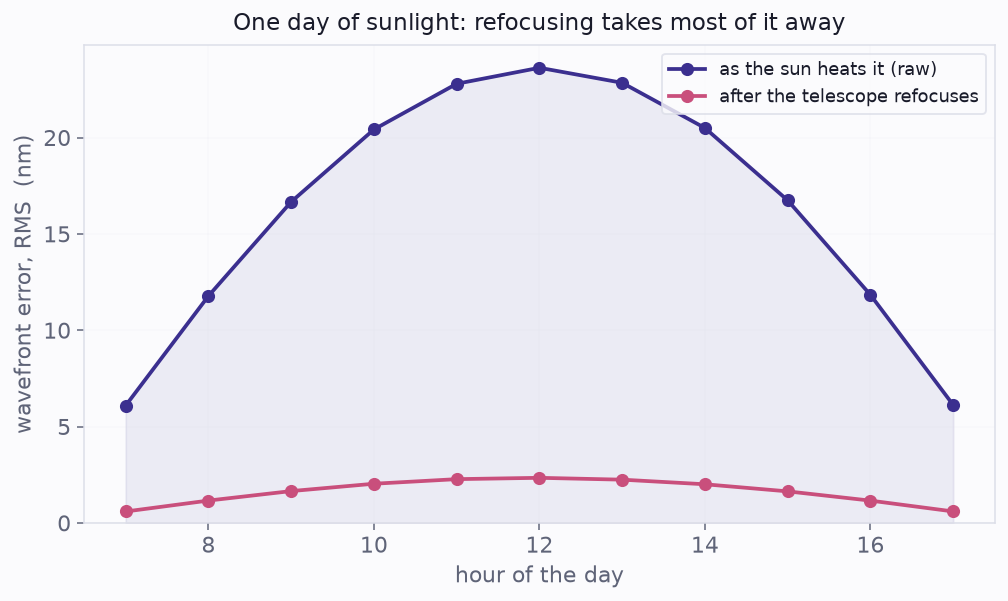
The refocus is dramatic because defocus really does carry the error. At noon the defocus term alone is about 11.1 nm of surface departure — which, doubled on reflection (the same surface-to-wavefront factor used throughout), is essentially the entire 23.6 nm raw wavefront; taking it out drops the wavefront error roughly 10.0x. If the story ended there, a day of sun would be a solved problem — refocus hourly and move on. It does not end there, because the directional load leaves something behind.
The residual rotates with the sun
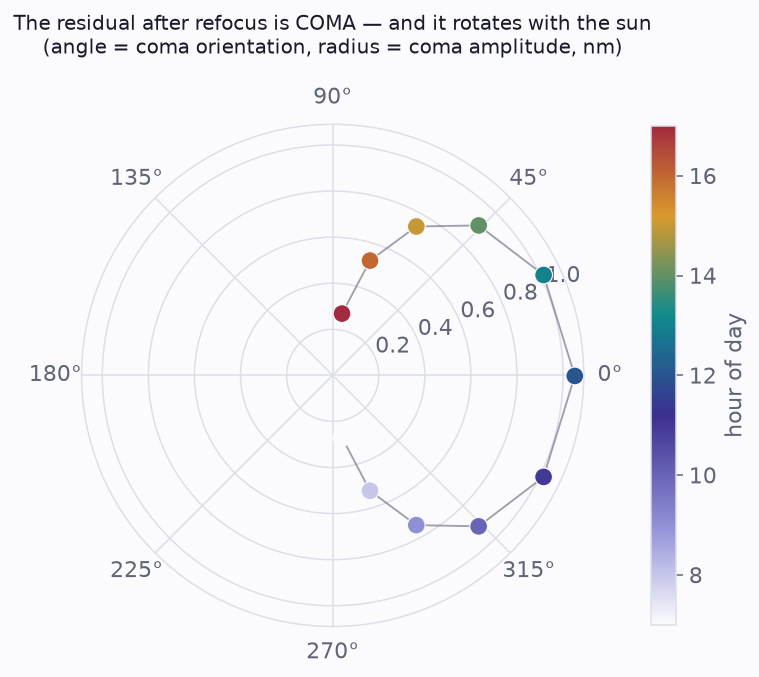
Coma is the signature of a one-sided load: the mirror bends more on the warm side than the cool side, and that asymmetry is not a bowl, so refocusing cannot flatten it. At noon it is only about 1.1 nm here — small against the defocus — but it is the floor. And the useful part is that it is not random: because the load direction is the sun’s direction, the coma vector sweeps a smooth arc through the day. A residual that repeats every day on a known schedule is exactly the kind a feed-forward correction, or an active-optics look-up table, can take out ahead of time instead of chasing it.
It is worth being clear about why the leftover is coma and not something a refocus could touch. A defocus is a bowl — a single curvature the whole mirror shares — and a bowl is exactly what moving the focus cancels. A one-sided warming does not make a bowl: the warm edge rises more than the cool edge, so the curvature itself varies across the mirror, and that lopsided, third-order shape is coma. Refocusing has only one knob and coma needs a different one, so no focus move flattens it. This is precisely the job active optics does at large observatories — a handful of actuators behind the mirror pushing out the low-order aberrations a thermal model like this one predicts. The value of running the whole day, rather than a single worst case, is that it turns “the mirror develops coma” into a schedule: how much, pointing which way, at which hour — the very table those actuators would follow.
Reading the aberrations
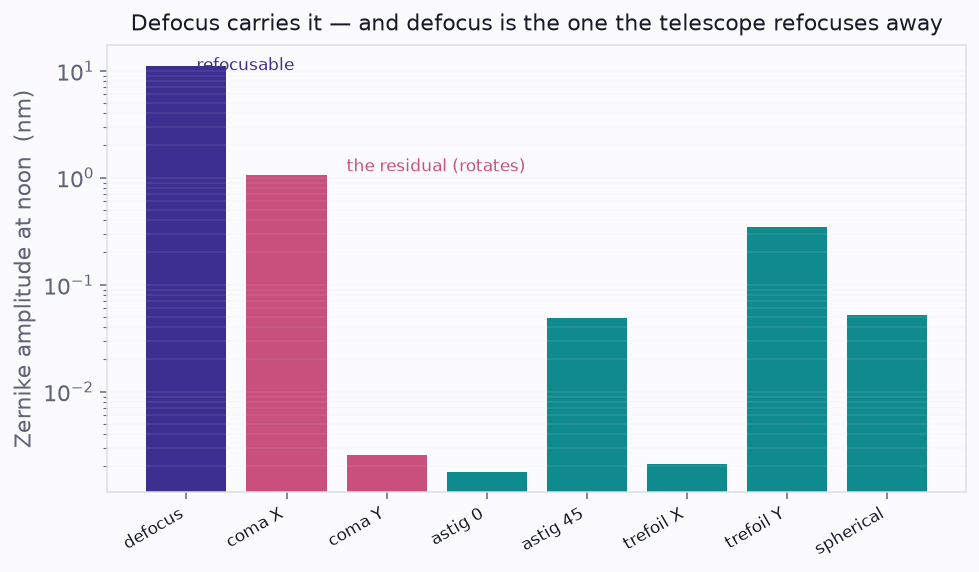
The breakdown makes the strategy concrete. Defocus is orders of magnitude above the rest and is handled for free by refocus. Coma is the second term and the one worth engineering against — through the mount, the baffling, or a scheduled correction. Everything below it is in the noise for this load. A thermal engineer can read straight off this chart which aberration to spend money on, and the day-cycle plot tells them when it is worst.
Comparing materials, or sizing a thermal budget, where the answer depends on how the comparison is normalized? The chain behind this study — Ansys Mechanical solving the temperature and the distortion in one coupled-field analysis, the gradient pinned against a Fourier closed form, the wavefront computed two independent ways, and the mesh convergence separating what converged from what did not — is how Rand Simulation helps optical and thermal teams find out whether a design choice is real physics or an artifact of the question. That's innovation through insight.