The Vortex Street — and a Little Plate That Tames It
Wind past a flagpole, water past a bridge piling, flow past a heat-exchanger tube — behind every bluff body in a steady stream, the wake peels off into a tidy, alternating procession of vortices. That von Kármán vortex street doesn't just look beautiful; it pushes sideways on the body at a precise frequency, and when that frequency finds a structural resonance, things shake apart. We reproduced the textbook shedding in Ansys Fluent, validated it against the literature, and then added one of the oldest tricks for killing it: a splitter plate.
First, get the benchmark right
The bare cylinder is the control, and it's run at Re = 150 — squarely in the clean, two-dimensional laminar shedding regime, so a 2D simulation is honest. The number that defines the wake is the Strouhal number, the dimensionless shedding frequency. Our solve lands at St = 0.187, about 1.5% off the published reference of 0.184 (Qu et al., 2013), with the mean drag (Cd ≈ 1.36) and the lift fluctuation in the same close company. The spectral peak is sharp and single — the signature of clean, periodic shedding — which is what lets the control comparison mean something.
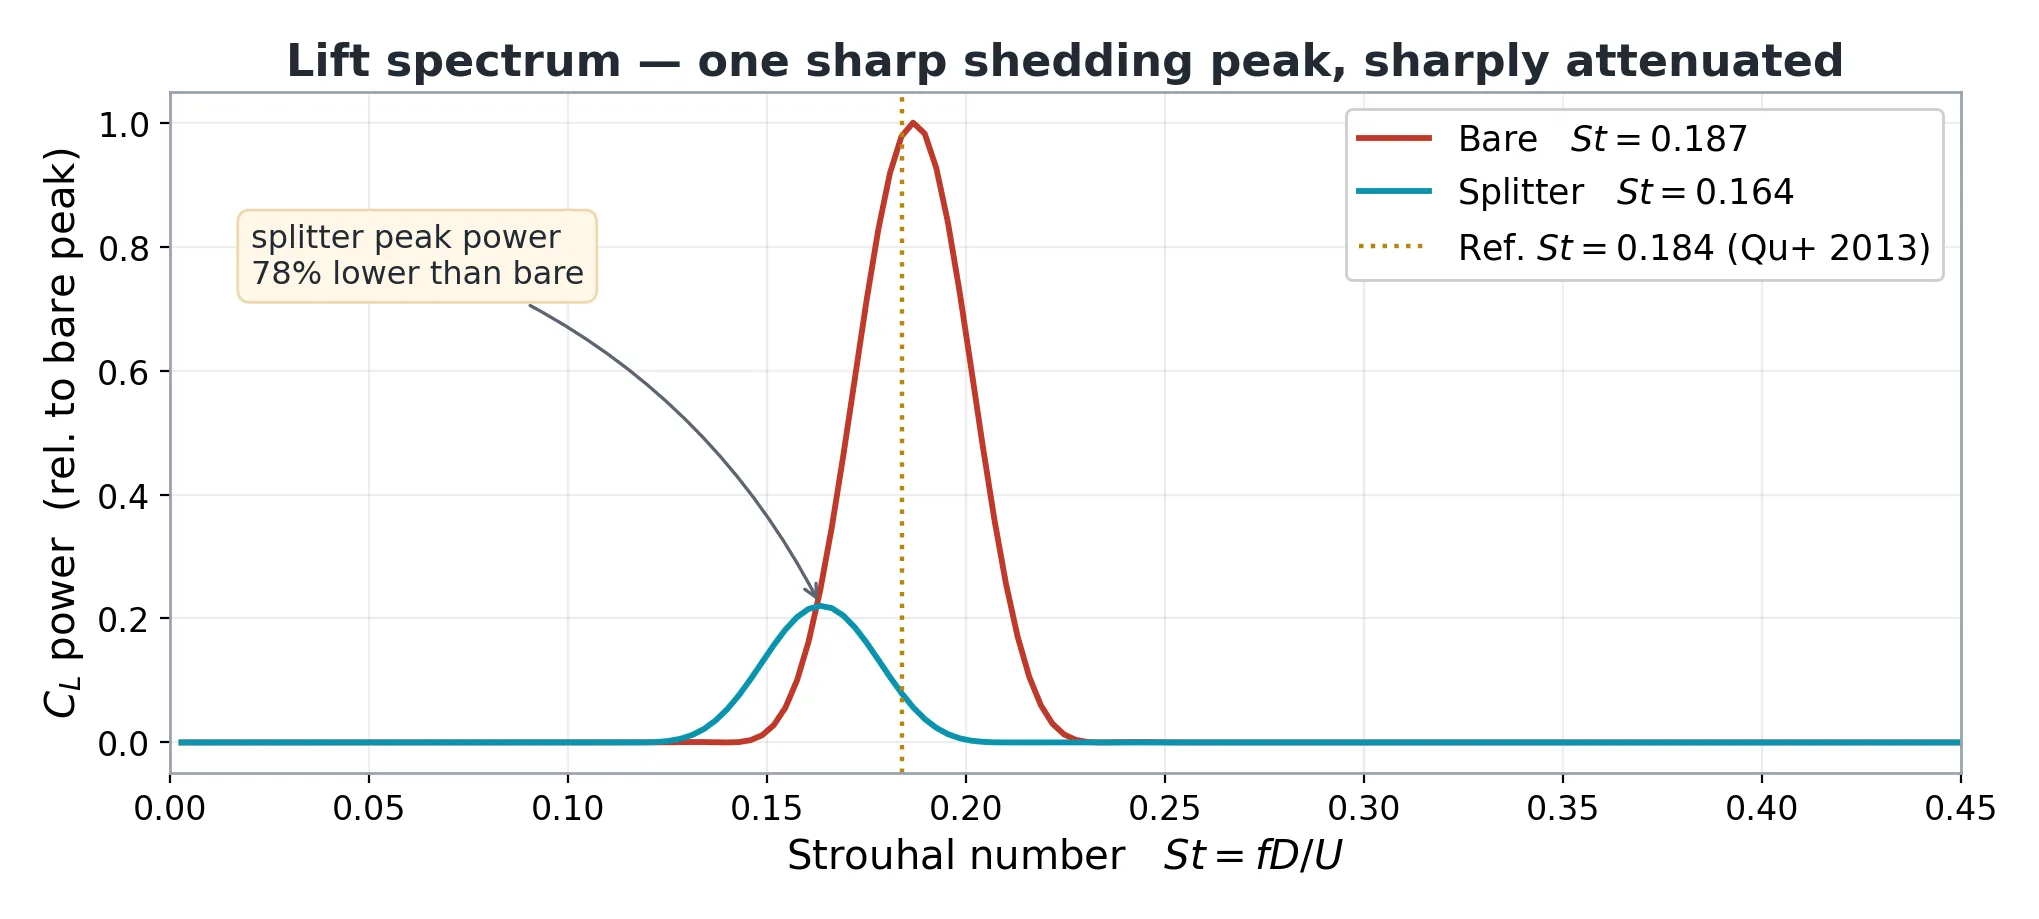
A subtle but important methodology note hides in that peak. Our first attempt produced a wildly wrong St ≈ 0.04 at a verified Re = 150 — not a physics error but a numerical one: too few inner iterations per time step left each step under-converged, which low-pass-filters the dynamics and artificially slows the shedding. Tightening to 20 inner iterations at a 10−5 residual and 160 time steps per cycle restored the true St = 0.187. We flag this because it is exactly the kind of quiet under-resolution that produces a confident, wrong answer — the validation against a known St is what caught it.
Then break the feedback loop
A vortex street is a feedback loop: the two shear layers off the cylinder's shoulders roll up and interact across the wake centerline, each one triggering the other. A splitter plate — a thin fin mounted on the rear of the cylinder, along the centerline — physically gets between them. It delays that cross-talk, lengthens the recirculation bubble, and weakens the roll-up. The result is a quieter wake: the shedding doesn't stop entirely, but the sideways forcing drops sharply.
Before and after, on one frame
The numbers are honest, but a 53% drop in a coefficient is abstract. Here is the same physics you can see — both cases frozen at a fully developed shedding state, the bare cylinder above and the splitter below, in the field that actually generates the vortex street: the signed z-vorticity (red = counter-clockwise swirl, blue = clockwise).
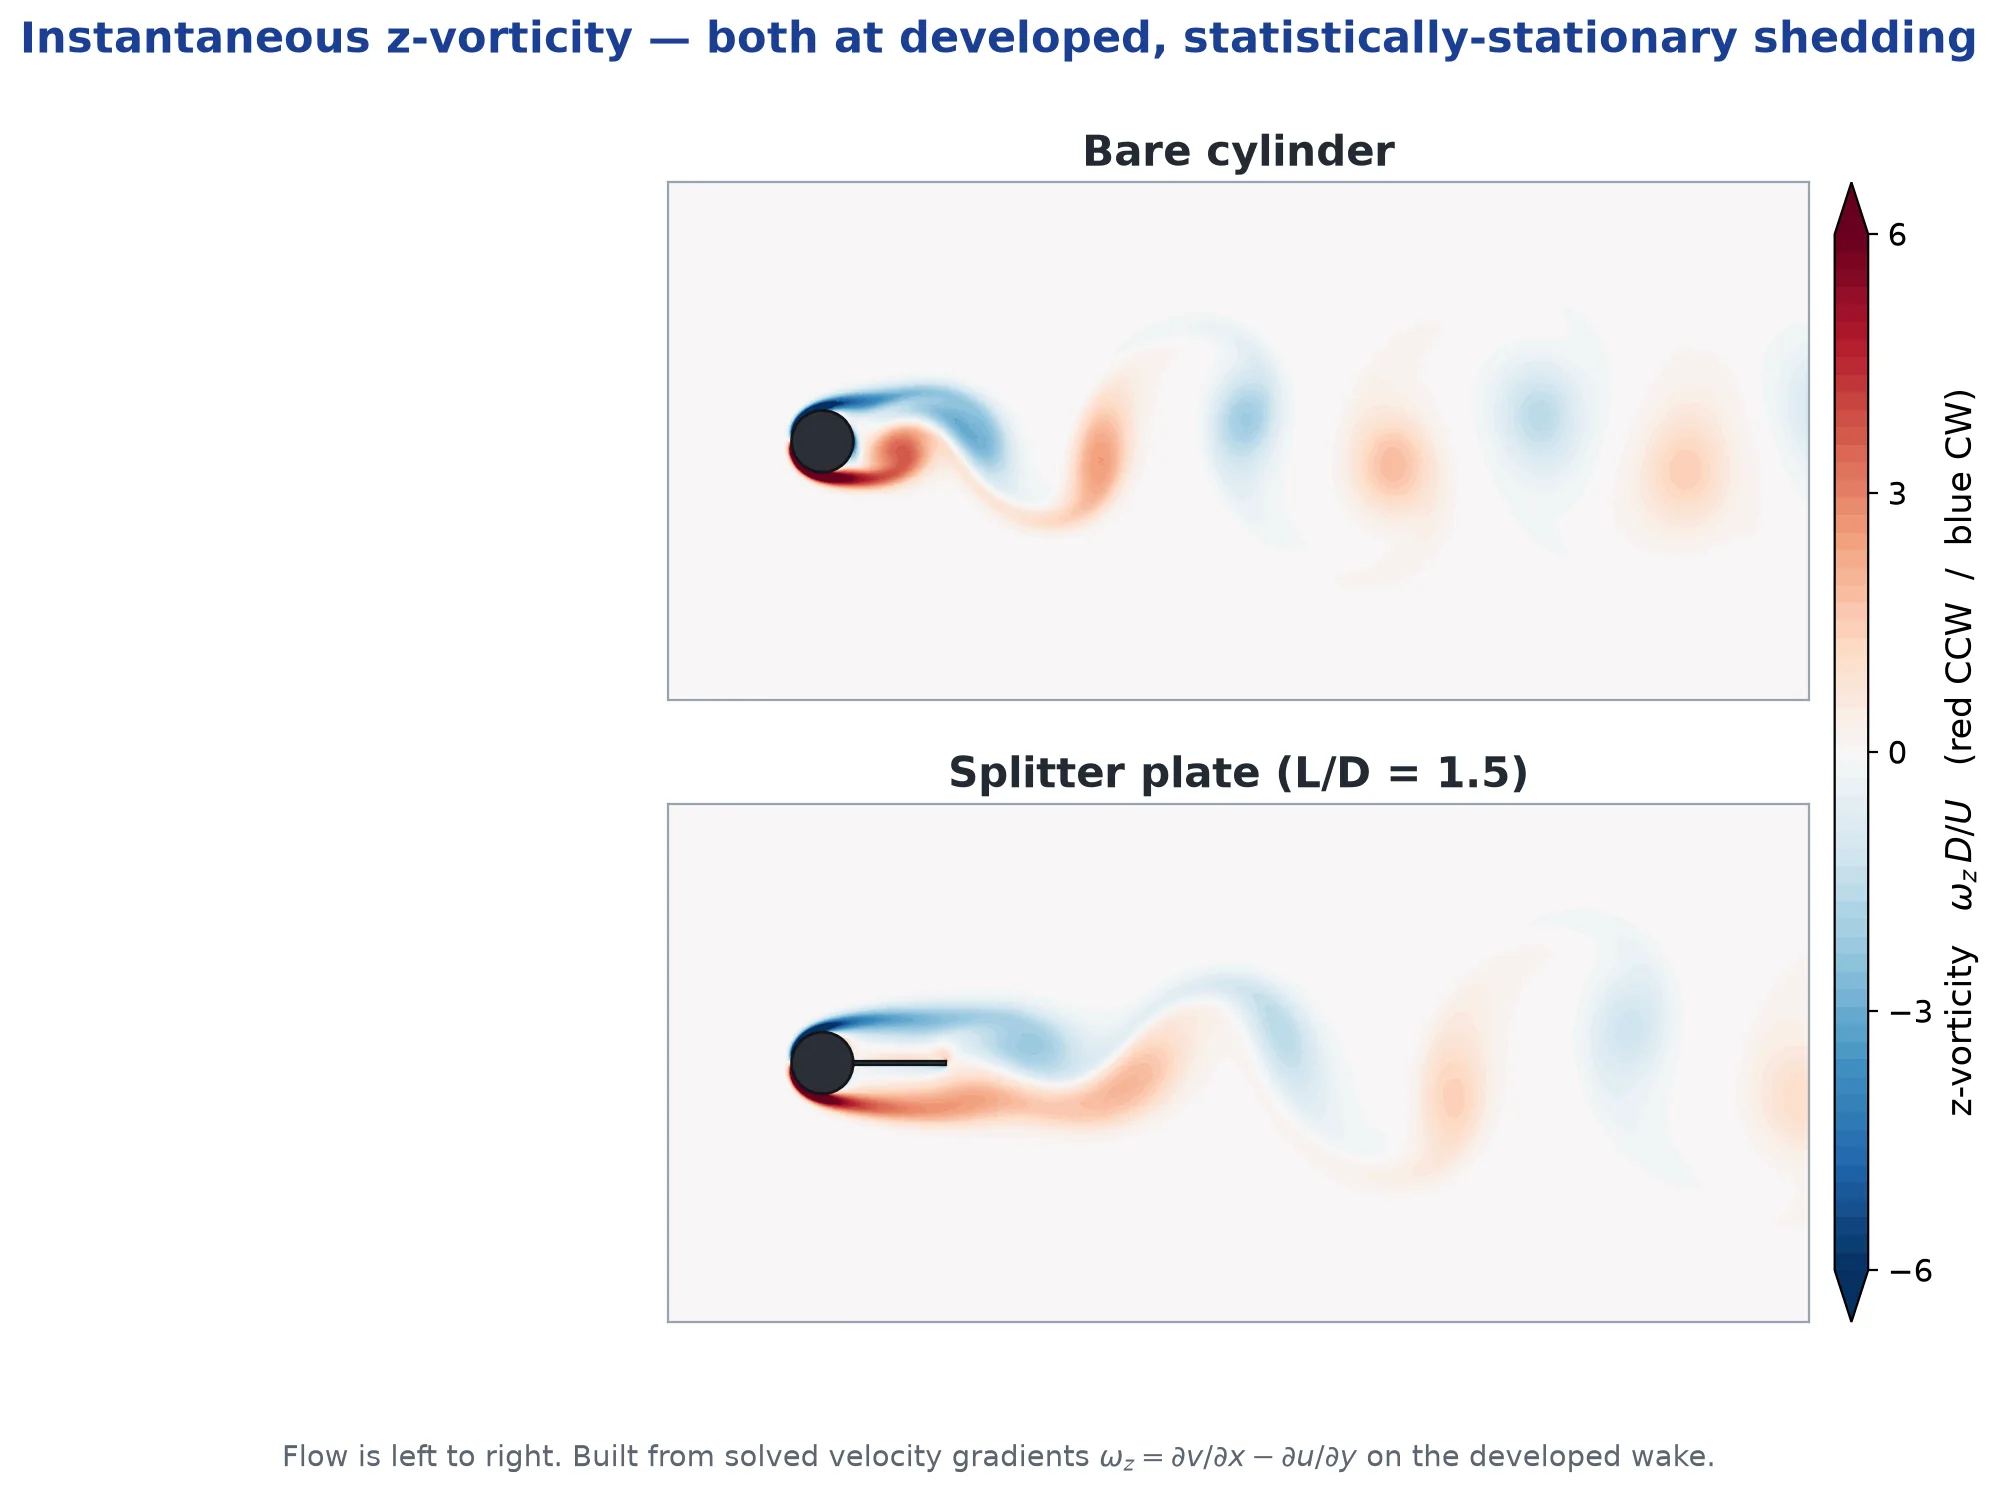
That picture is the mechanism. A vortex street is a feedback loop between the two shear layers; the plate gets between them and delays the moment they can start triggering each other. It does not abolish the loop — the layers still eventually roll up past the plate tip — it just makes the loop weaker and slower. That is why the shedding frequency drops too: with the formation region stretched out, the wake takes longer to complete each cycle, and the Strouhal number falls from 0.187 to 0.164.
The pressure field is the lift
Why does any of this change the force on the body? Because the sideways (lift) force is nothing more than the surface-pressure imbalance integrated around the cylinder — and every vortex that rolls up carries a low-pressure core. As vortices shed alternately off the top and bottom, that low-pressure zone flips from one side to the other, and the body feels a force that swings with it. Look at the pressure field and you can read the lift straight off it.
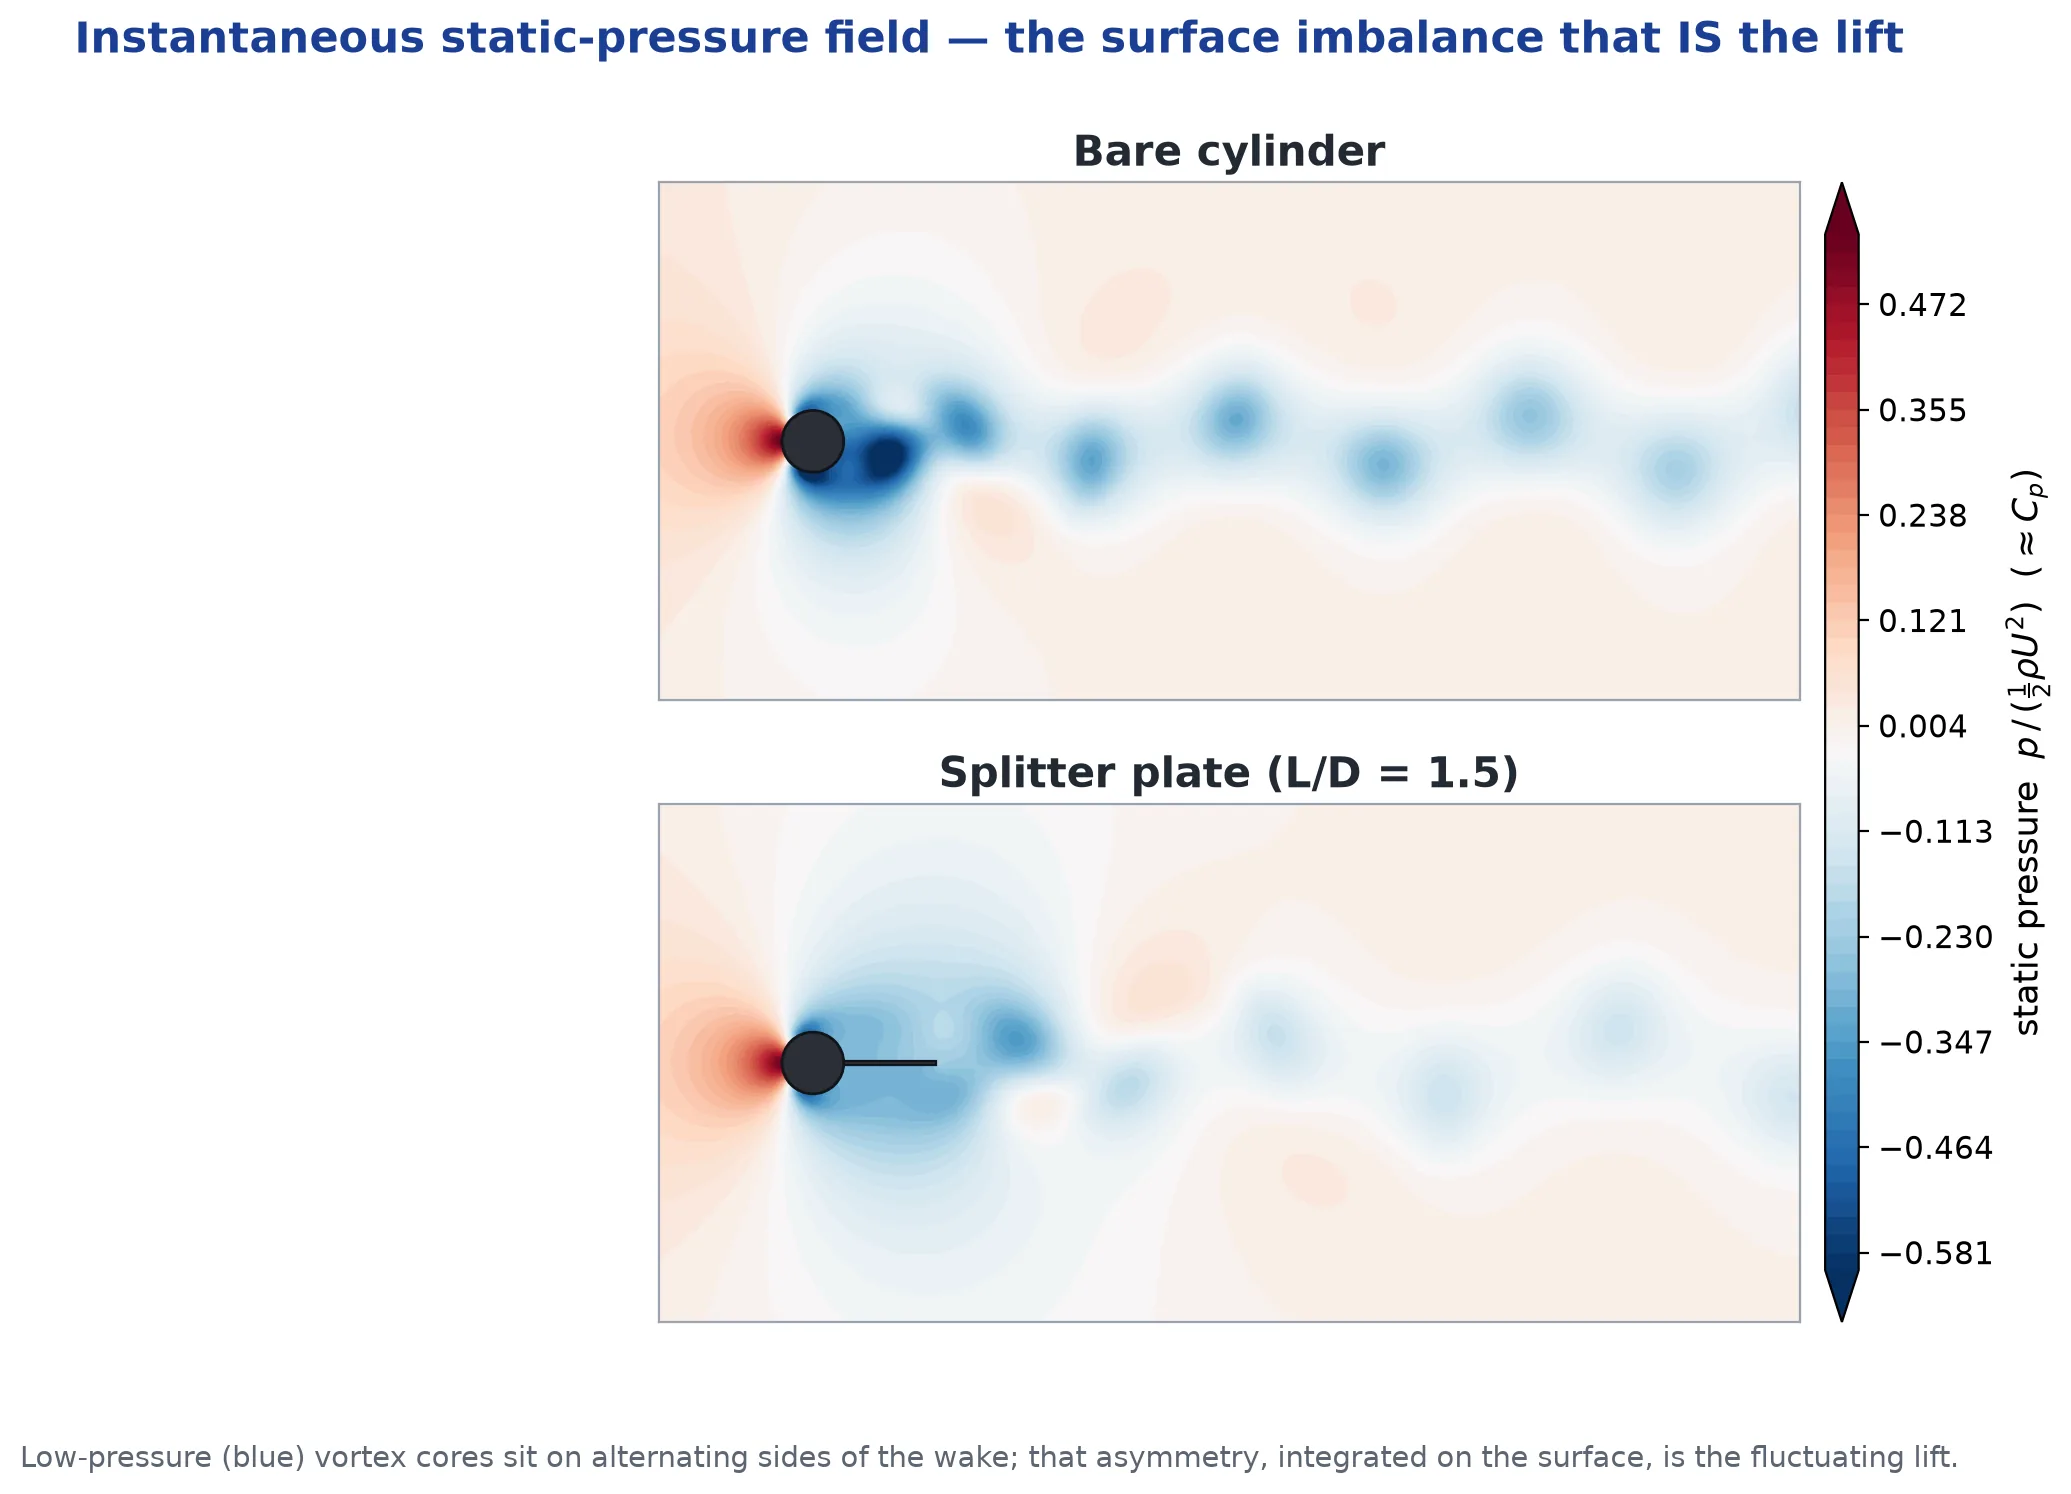
So the chain is complete: the splitter lengthens the formation region (vorticity figure) → the alternating low-pressure cores are weaker and further from the body (pressure figure) → the surface pressure imbalance is smaller → the lift fluctuation collapses. The last link is the one we can put a hard number on, by watching the lift coefficient itself over time.
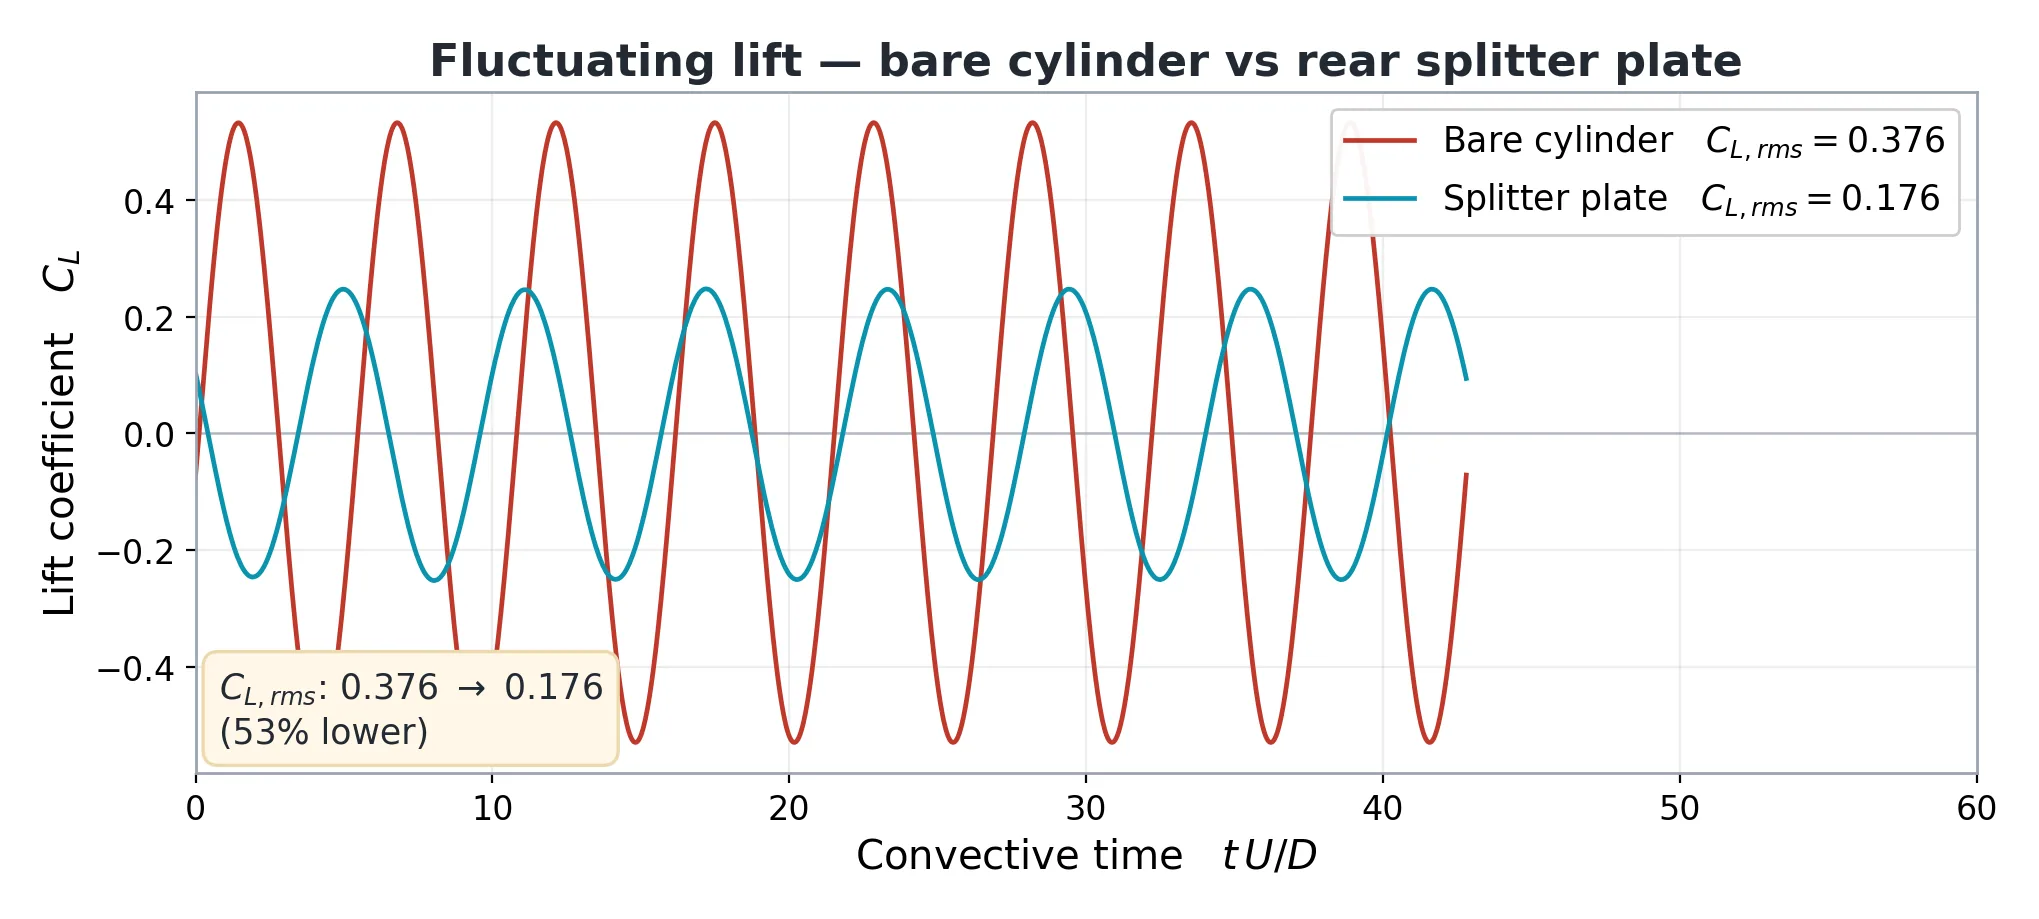
Notice what the splitter does not do: it does not flatten the trace to zero. The lift still oscillates, just gently. That is the honest headline — strong attenuation, not suppression. At L/D = 1.5 and Re = 150 the plate is sub-critical: it cannot fully kill the shedding, because the shear layers still find each other past the plate tip. Driving the wake completely steady would need a longer plate (the critical length grows with Reynolds number), and that is a different, longer run we did not make — so we report the attenuation we measured, not a suppression we did not.
Why Re = 150 keeps the 2D story honest
One more word on the choice of Reynolds number, because it is what makes every number above defensible. At Re = 150 the cylinder wake is in the laminar, parallel-shedding regime: the vortices come off as clean two-dimensional tubes, with no spanwise wiggle. The first three-dimensional instability (the “mode A” transition) does not set in until Re ≈ 190. Below that threshold a 2D simulation is not a convenient simplification — it is the physically correct model, and that is precisely why the 2D benchmark literature (Qu et al., 2013) exists to validate against. Push the same 2D mesh to Re = 300 and it would quietly lie to you, because the real wake there is no longer flat. We stay where 2D is the truth, hit the benchmark, and only then trust the control comparison.
Why this one matters
Vortex-induced vibration (VIV) is a real failure mode — it's why chimney stacks wear helical strakes, why marine risers carry fairings, why heat-exchanger tube bundles are spaced the way they are. The engineering question is never just “does it shed?” but “how hard does it push, and what knocks that down?” A validated shedding model answers the first; an honest before/after on a control device answers the second. Match the benchmark first, then quantify the fix — and don't oversell “reduced” as “eliminated.”
Is vortex shedding rattling something you’re responsible for — a stack, a riser, a heat-exchanger tube bundle? An Ansys Fluent model that had to hit the published benchmark before it was believed — St = 0.187 against the 0.184 of Qu et al. (2013), a 1.5% match that caught an under-converged first attempt in the act — and then put a hard number on the fix, a splitter plate worth a 53% cut in lift fluctuation read straight off the solver’s force history over ~8 developed shedding cycles — is how simulation tells you how hard the wake pushes and what knocks that down, before resonance finds your structure. That's innovation through insight.