Lighting Is the Algorithm: Designing a Scratch-Detection Vision Station in Speos
Automated optical inspection (AOI) lives or dies on one decision most people make last: the lighting. A shallow scratch on a brushed-aluminum part can be glaringly obvious or completely invisible depending only on where the light comes from — the same defect, the same camera, the same software. Before you buy a ring light and start tuning thresholds, you can simulate the whole optical station and find the geometry that makes the defect pop. We did exactly that in Ansys Speos, comparing three classic lighting schemes against a real scratch.
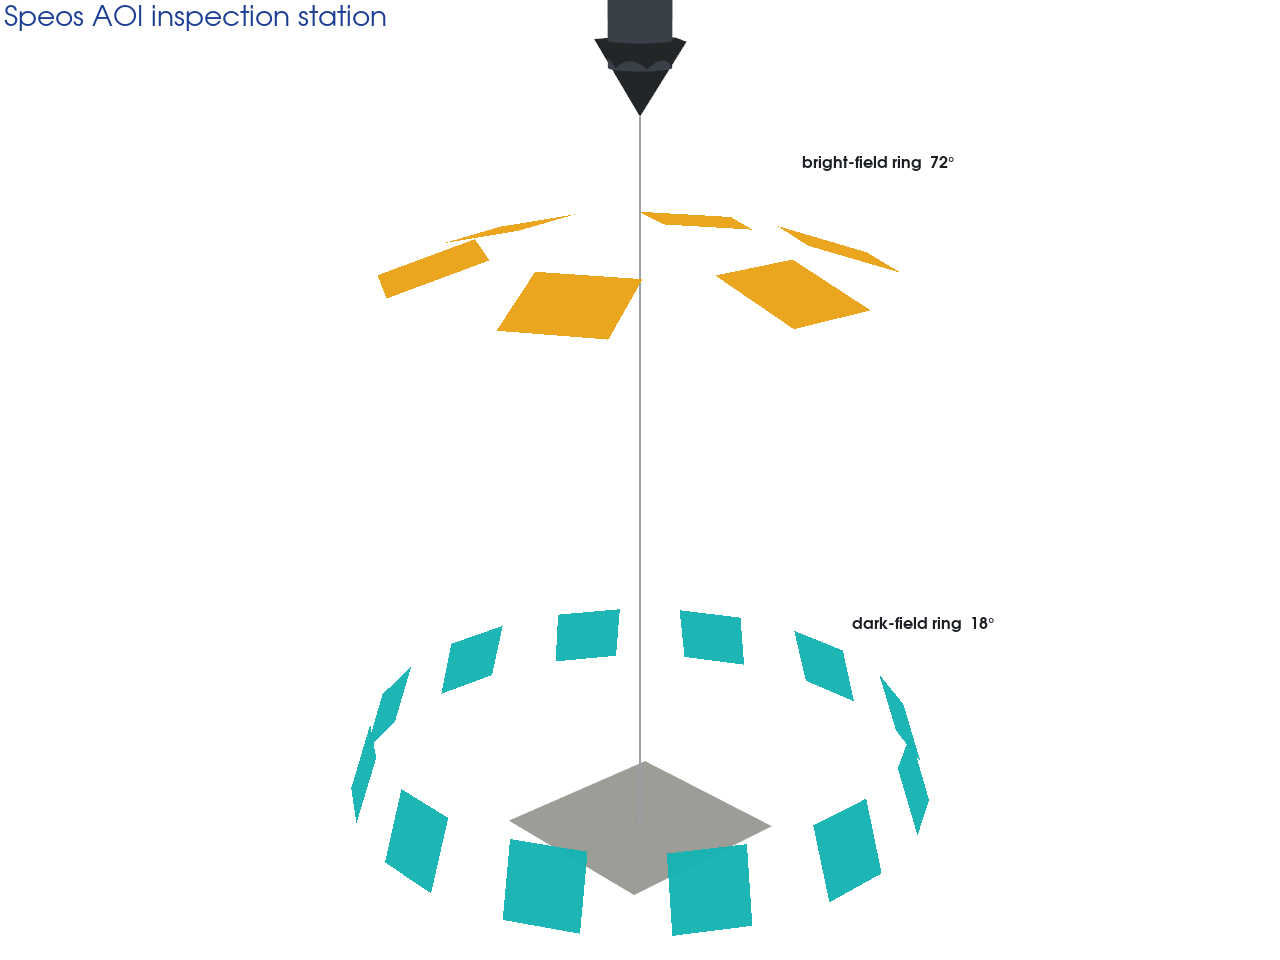
One part, three ways to light it
The target is a satin (brushed) aluminum plate carrying a shallow groove, lit by a calibrated radiance sensor standing in for the inspection camera. The aluminum is modeled with the Speos library's measured Metal Satin Alu BRDF — a semi-specular surface with a broad specular lobe over a diffuse pedestal, which is what makes the lighting choice so consequential. We test three geometries:
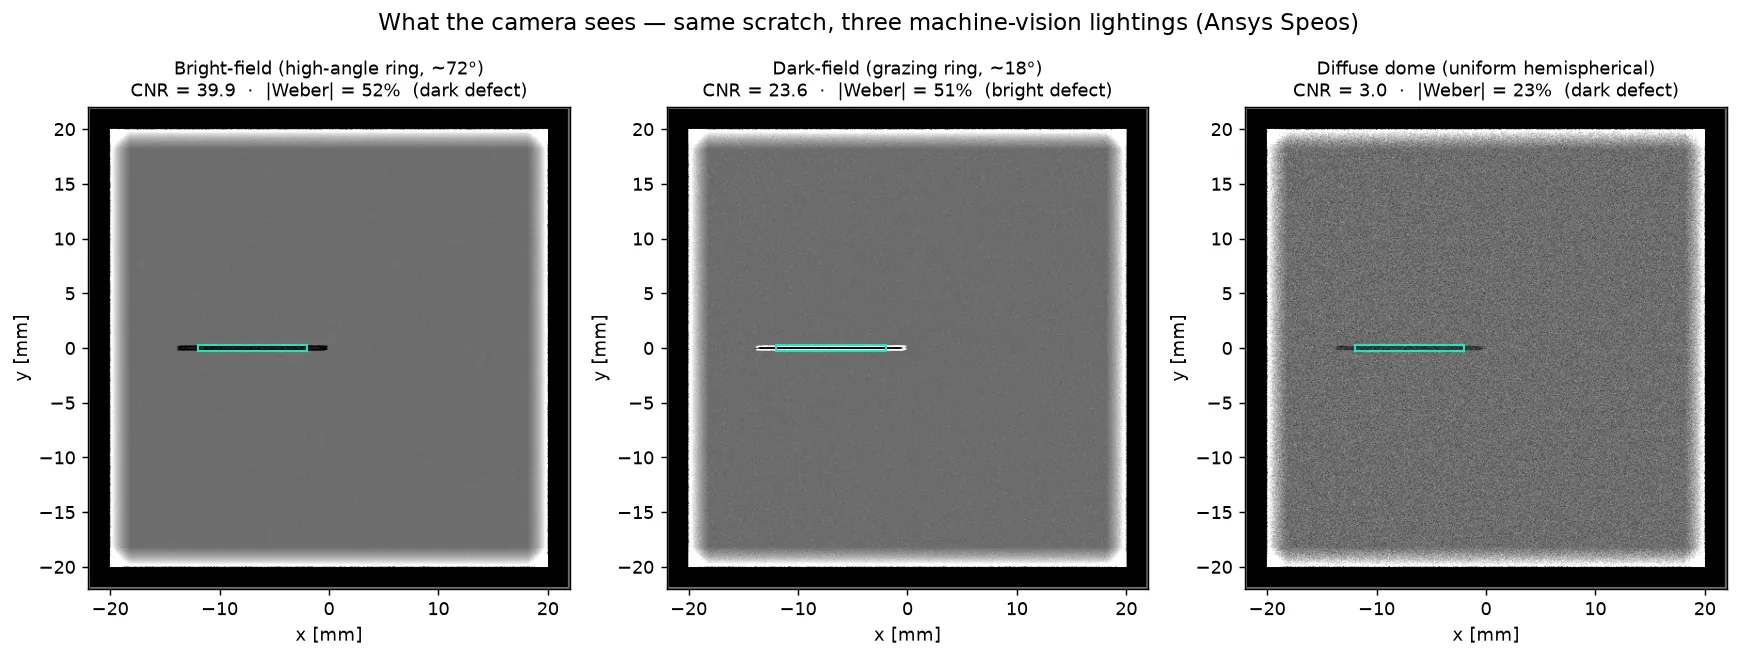
- Bright-field — a steep, near-full ring (~72°) that floods the surface; the flat field reads bright and the scratch shades it slightly, producing a dark line.
- Dark-field — a grazing ring (~18°); the flat field reflects away from the lens and reads dark, while the scratch walls catch the grazing beam and glow — the classic textbook scratch geometry.
- Diffuse dome — near-uniform light from every direction; glare-free and even, but a topographic scratch produces almost no directional contrast.
The metric: can a camera actually see it?
Pretty renders aren't enough; the question is whether the defect clears a detectability threshold. We score each scheme with contrast-to-noise ratio: CNR = |Idefect − Ibg| / σbg, where Idefect and Ibg are the mean luminance of the defect pixels and of a background region after flat-field correction, and σbg is the spatial standard deviation of that corrected background. With each image normalized so the background sits near 1.0, the three noise floors come out at 0.0130 (bright-field), 0.0215 (dark-field) and 0.0755 (dome). Worth being precise about that denominator: the modeled camera is a noiseless calibrated radiance sensor, so σbg is the brushed surface's own texture plus residual ray-sampling noise from the Monte Carlo render — not camera noise. Against that floor we apply the Rose criterion, the rule of thumb that a feature needs CNR > 4 to be reliably seen above the background noise floor.
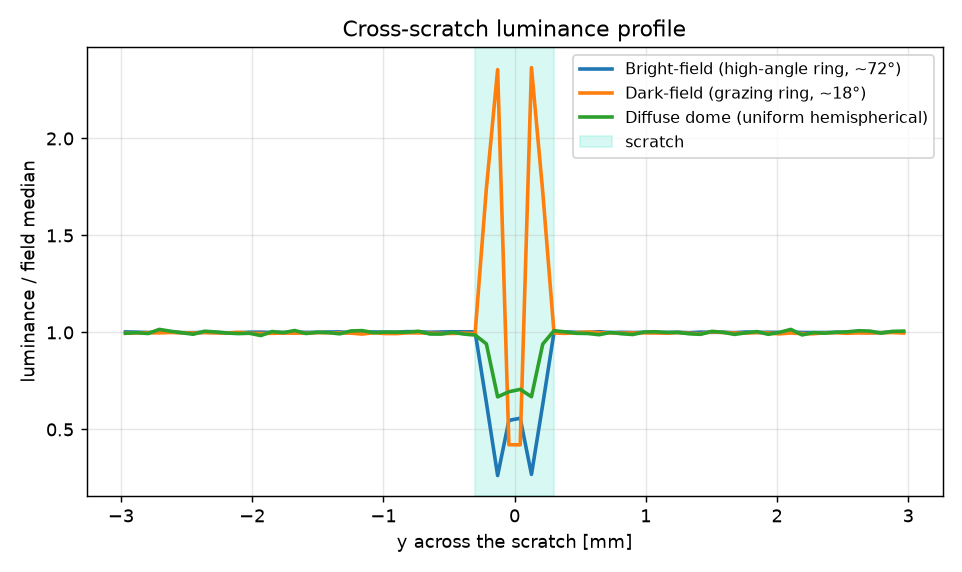
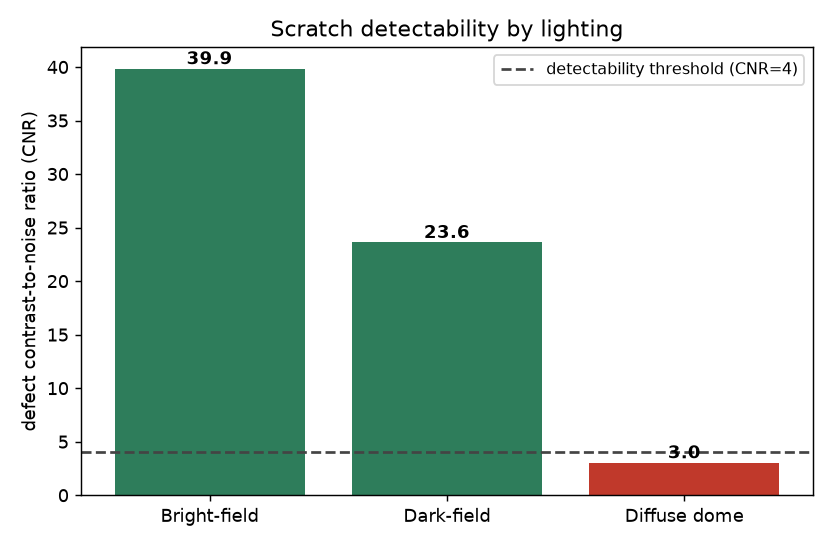
A number that big deserves decomposition, because two different things move it. The defect's own signal — the Weber contrast |Idefect − Ibg| — varies only about 2.2× from the best scheme to the worst. The other ~5.8× of the swing is carried by the denominator: how smooth each scheme renders the flat field. That is a real effect (the dome floods the brushed texture with light from everywhere; the steep bright-field ring irons the specular field flat), but one caveat is owed: the dome delivers roughly 19× less flux to the sensor than bright-field, so part of its 6×-higher noise floor may be Monte Carlo sampling speckle rather than physics — its CNR ≈ 3 is the softest number of the three, even if the washout verdict is not in doubt. The bright-field-versus-dark-field margin, meanwhile, is almost entirely a smoothness win: their defect contrasts come out nearly equal, and bright-field's lower σbg (0.0130 vs 0.0215) is what carries its CNR ≈ 40 past dark-field's ~24.
Why this one matters
Vision-system integrators spend weeks tuning thresholds to compensate for lighting that was never right in the first place. Simulating the optical station up front — real surface BRDF, real sensor, a quantitative CNR score — turns “try a few lights and see” into an engineering decision made before any hardware is bought. And the headline lesson is the counter-intuitive one: the textbook answer (dark-field for scratches) isn't always the winner; on a semi-specular finish, the data picks bright-field. Let the simulation choose the light.
Still picking inspection lighting by mounting a few rings and seeing what the camera catches? Ansys Speos, running a measured satin-aluminum BRDF under a calibrated radiance sensor and scoring bright-field, dark-field, and dome by contrast-to-noise ratio against the Rose criterion — a ~13× detectability swing, with bright-field at CNR ≈ 40 overturning the textbook dark-field pick — is how simulation finds the geometry that makes your defect pop before a single light is bought. That's innovation through insight.