Can a Giant Fan Move a Rain Cloud?
Everyone who has watched one valley flood while the next county rations water has had the same thought: the rain is right there — why can’t we push it where it’s needed? A reader asked us exactly that, and proposed the two machines everybody imagines: a huge fan to shove the clouds sideways, or a huge funnel to pipe the water somewhere drier. We took the daydream seriously enough to build it. In Ansys Fluent we raised the most powerful fan humanity could plausibly construct — a 100-meter disk, the size of a wind-turbine rotor, blowing at 25 m/s on 75 megawatts — aimed it across six kilometers of open atmosphere, solved the winds a storm supplies on its own, and then dropped virtual raindrops through every one of those solved wind fields to see where they actually land. The honest answer: locally, a little — regionally, not even close. And the numbers that explain why are more fun than the daydream.
A Cloud Is Not an Object
The first thing the physics insists on: a cloud is not a thing you can push. It is ordinary air — about a kilogram and a quarter per cubic meter — holding roughly half a gram of liquid water per cubic meter as droplets. The white shape is just where the water became visible. “Push the cloud” therefore means “push the air,” thousands of vertical meters of it, over the tens of kilometers a storm occupies. So the fan question becomes a clean, solvable one: how far into the atmosphere does the strongest buildable fan actually reach, and how does its push compare with the pushes the atmosphere already contains?
Our fan is deliberately absurd: a 100-meter-diameter disk — eight times the largest wind-tunnel fans ever built, the swept size of a large wind turbine run backward — mounted with its hub 150 m above the ground, driving air at 25 m/s (a 56 mph gale) across its whole face. That takes about 75 MW of ideal jet power, a mid-size power plant driving one machine. We gave it every advantage: a perfectly calm, neutral, dry atmosphere with nothing to fight but its own physics.
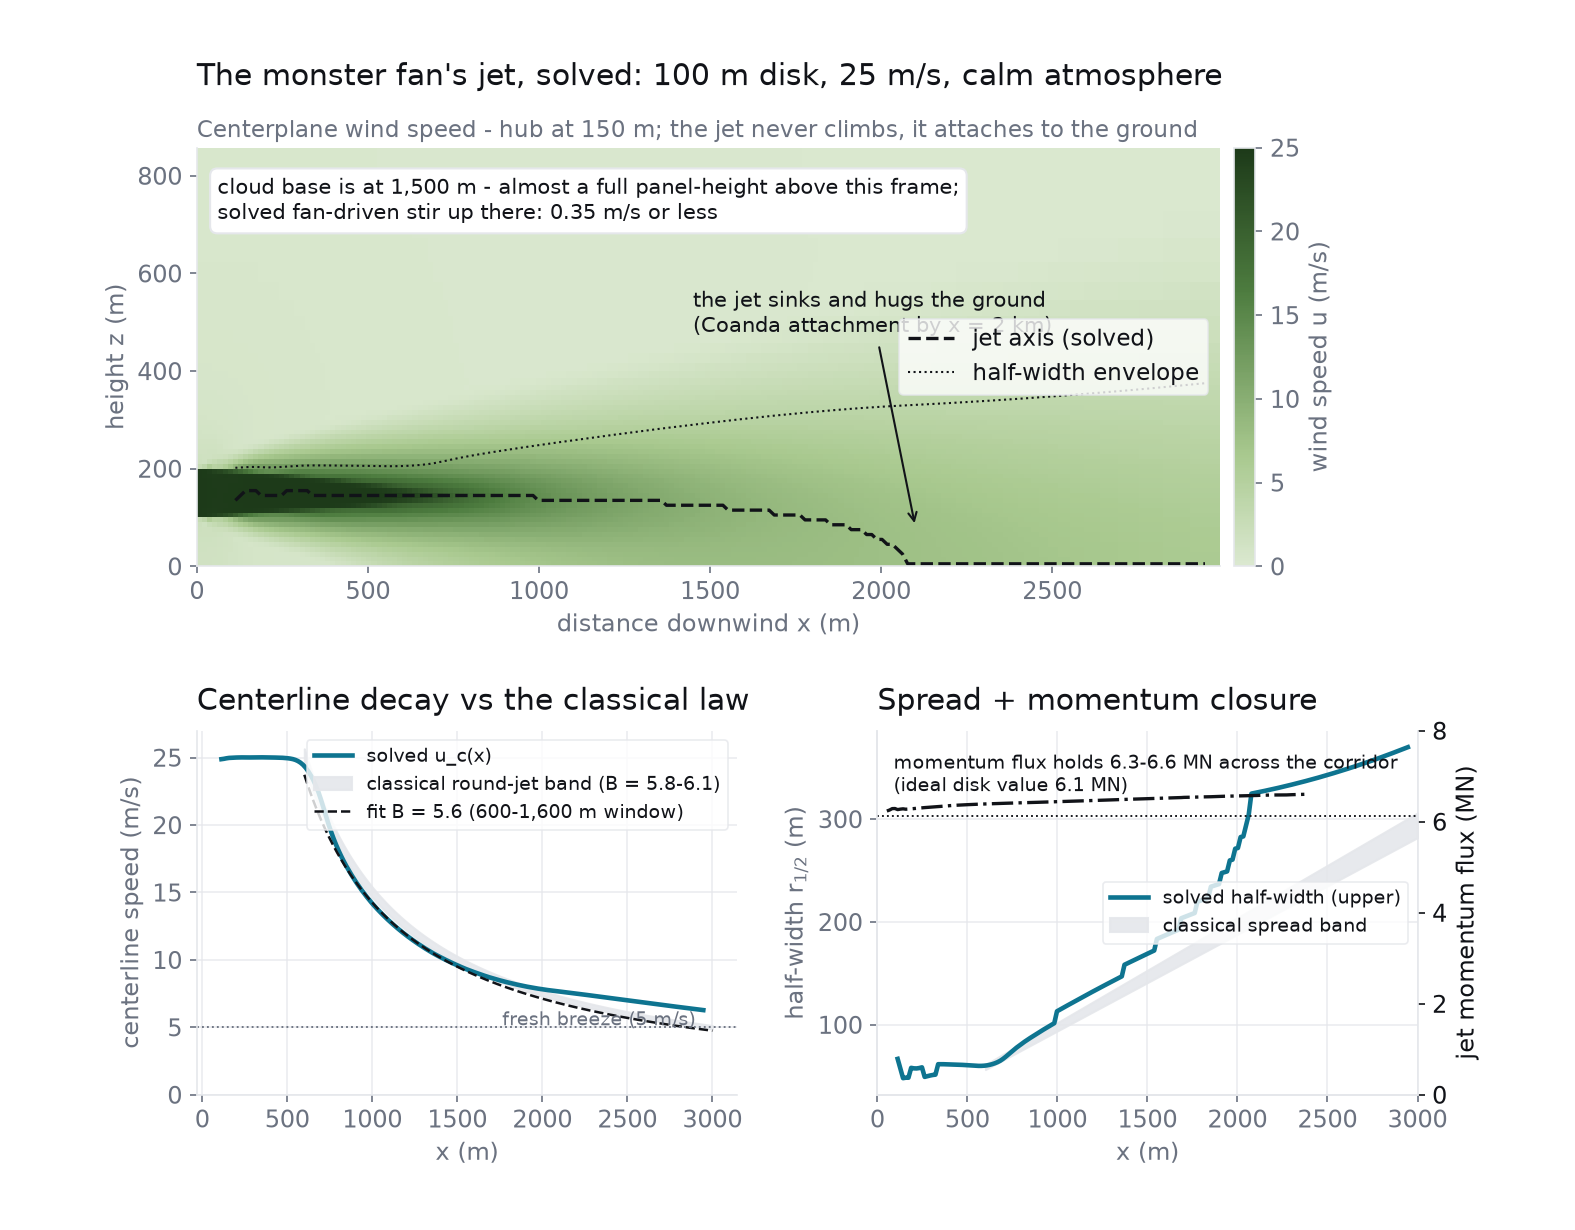
The solve produced one result we did not script: the jet never climbs toward the cloud at all. It sinks. With the ground so close beneath the disk, the jet cannot pull in air from below, so it curves down and hugs the terrain — by two kilometers out it is a ground-hugging wall jet. Even the version of this machine people imagine, tilted up at the sky, only delays the verdict: aim the axis 12° upward and simple geometry says the centerline reaches the 1,500 m cloud base around seven kilometers out — long after the jet has decayed below a light breeze. The solved field puts a number on what actually arrives at cloud height directly above the machine: 0.35 m/s, at most. A cloud parcel parked in the fan’s strongest cloud-level influence for a full hour of 75 MW blowing would move about 1.3 km — and storms rebuild themselves in minutes.
The Wind Nature Supplies for Free
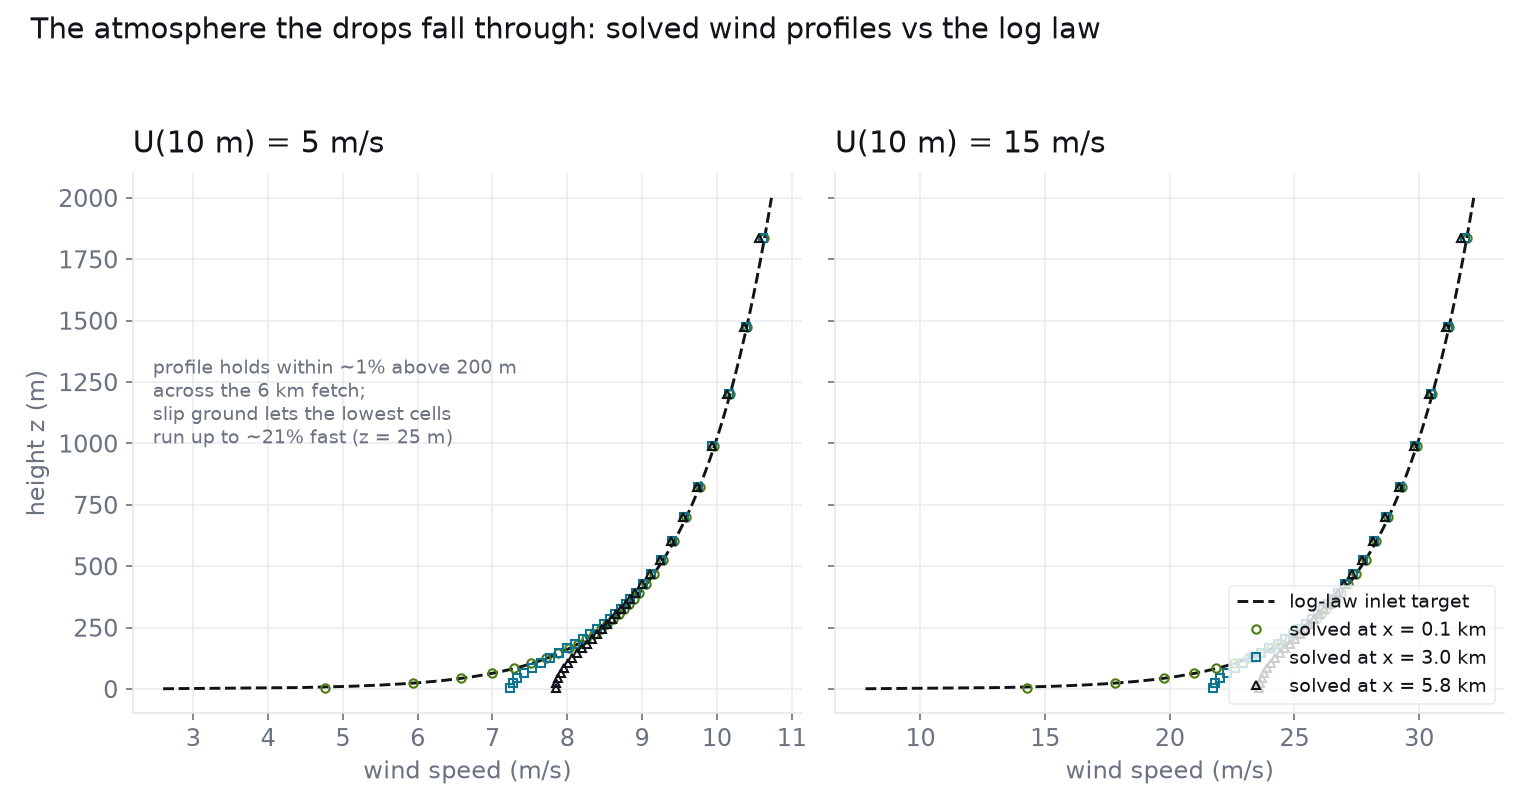
To compare the fan against the atmosphere’s own lever, we solved the same domain with no fan and a standard atmospheric-boundary-layer wind blowing through it — the logarithmic profile every wind engineer uses, anchored at 5 m/s and 15 m/s at the 10-meter reference height, over open storm-inflow terrain. These are unremarkable winds: a flag-stirring breeze and a rough day at the coast.
Where the Rain Actually Lands
Now the part the reader actually asked about: the rain, before it lands. A raindrop falls at a terminal velocity set by its size — measured definitively by Gunn & Kinzer in 1949: a 0.5 mm drizzle drop sinks at 2.06 m/s, a 4 mm downpour drop at 8.83 m/s. While it falls from a 1,500 m cloud base, the horizontal wind carries it. That ratio — wind speed integrated over the fall, divided by fall speed — is the one honest lever anyone has on where rain lands, and nature works it constantly.
We released drops of 0.5, 1, 2, and 4 mm at cloud base and tracked them down through each solved wind field — trajectories integrated offline through the Fluent-solved wind field, each drop anchored to its Gunn & Kinzer terminal velocity, with a drag response time consistent with that terminal balance. Two independent checks pin the method: in still air the drops land exactly where they were released, falling at exactly their published speeds; and a closed-form estimate of drift (the wind profile integrated over the fall, divided by fall speed) agrees with every integrated landing within 1.2%.
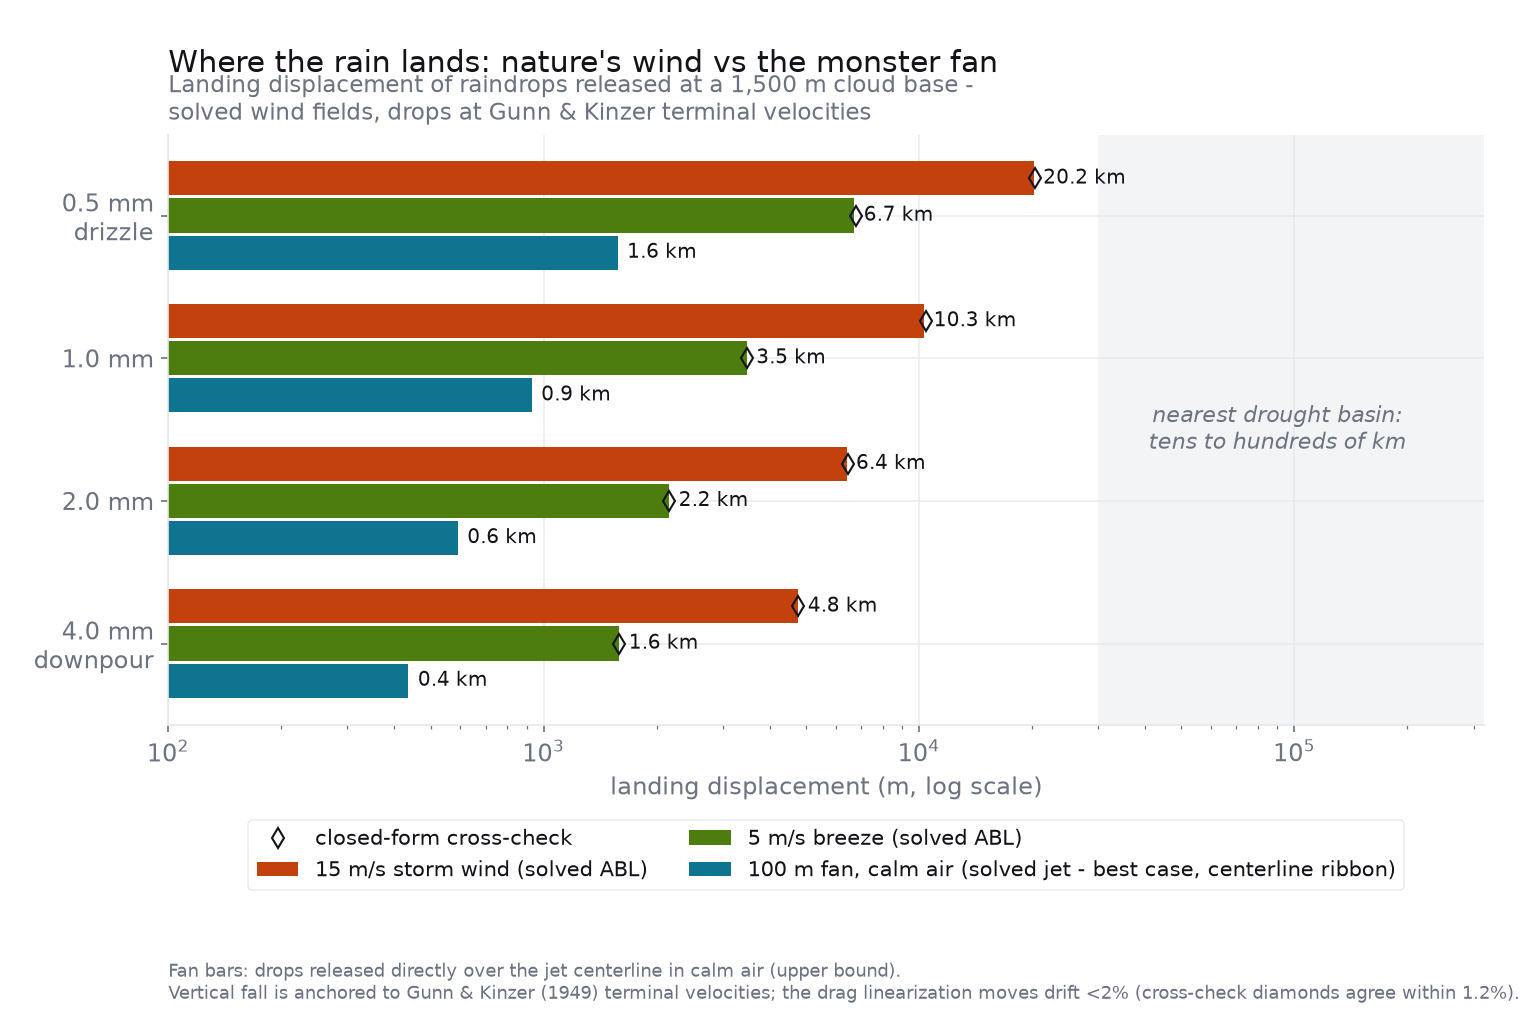
Two honest surprises, reported as solved. First, the fan moves drizzle more than back-of-envelope jet theory suggested — up to 1.6 km, not a few hundred meters — because the ground-attached jet keeps gale-force air in exactly the layer a slow drop spends its last three minutes falling through; small drops surf it. Second, that generosity changes nothing regionally: the affected ribbon is so narrow that the relocated water is a rounding error on the storm, and it lands one mile away, not one county away. The localization check confirms the effect is real and confined: drops released upwind of the fan, or outside the jet’s footprint, land exactly where calm air would put them.
The Scale of the Ask
Why does a 75 MW machine lose this badly? Because the atmosphere is simply operating in a different weight class, and the comparison takes one line of arithmetic per contender — labeled as arithmetic, with the fan’s own number coming from the solve.
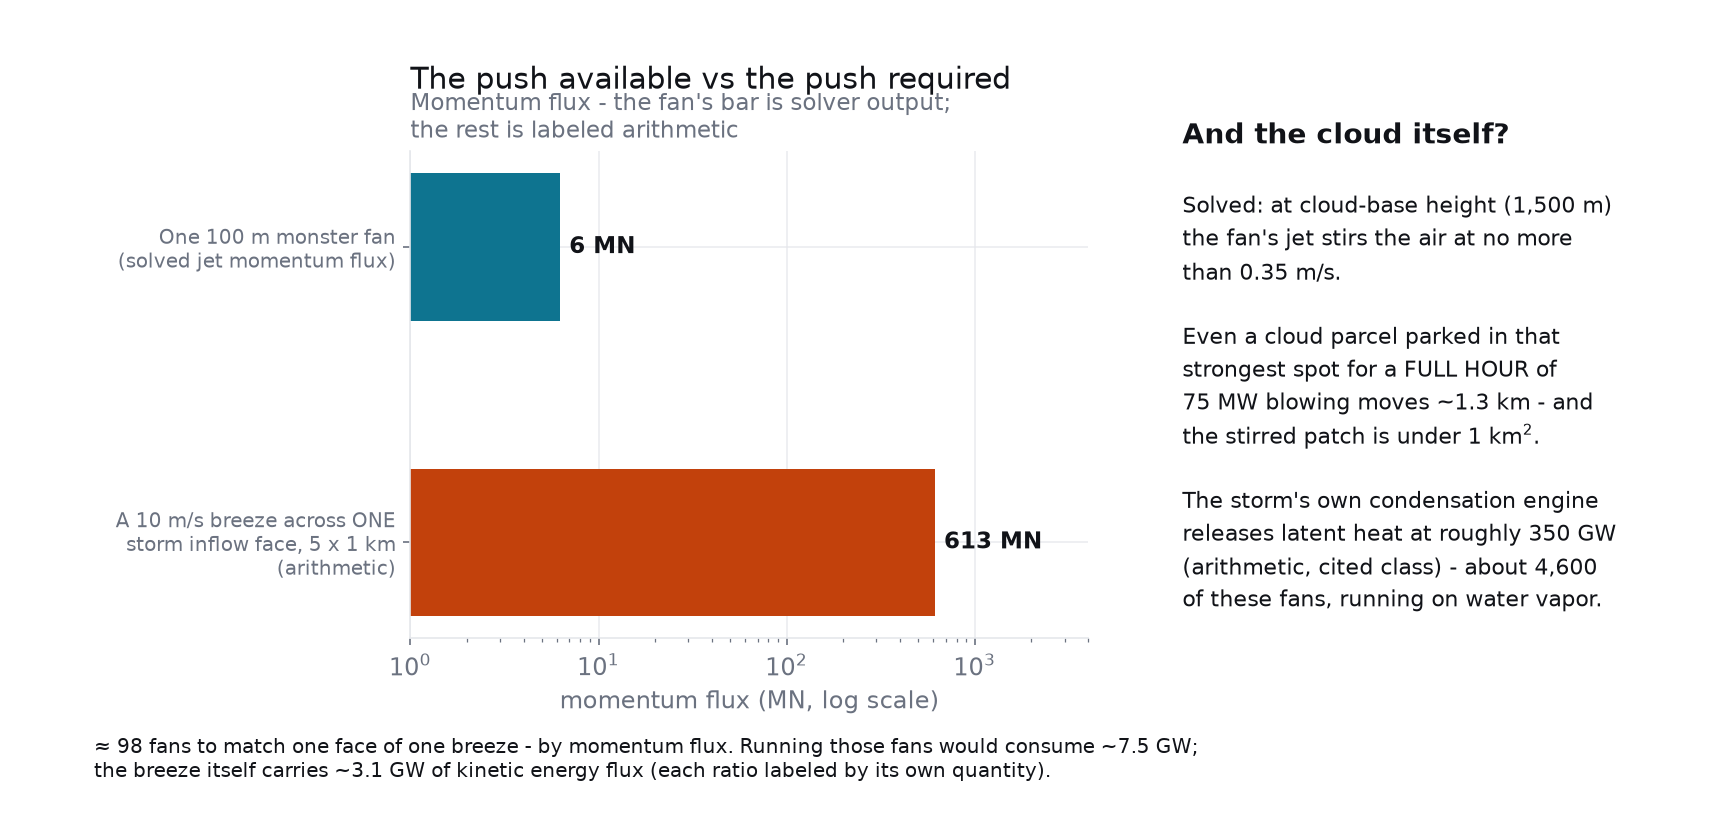
This is the pencil-versus-ocean picture worth remembering: the fan’s jet, heroic as it is, is a ±200-meter thread of moving air under a storm that is ten kilometers wide, powered by an engine four thousand times stronger than the fan. Nothing about better fans fixes that; the mismatch is the atmosphere’s size, not our engineering.
The Funnel, and the Wildfire Question
The reader’s second machine — the huge funnel — dies by arithmetic alone, so we checked it that way and label it that way: no funnel was solved. A storm rains over an area the size of a county; any buildable mouth is a dot on that map.
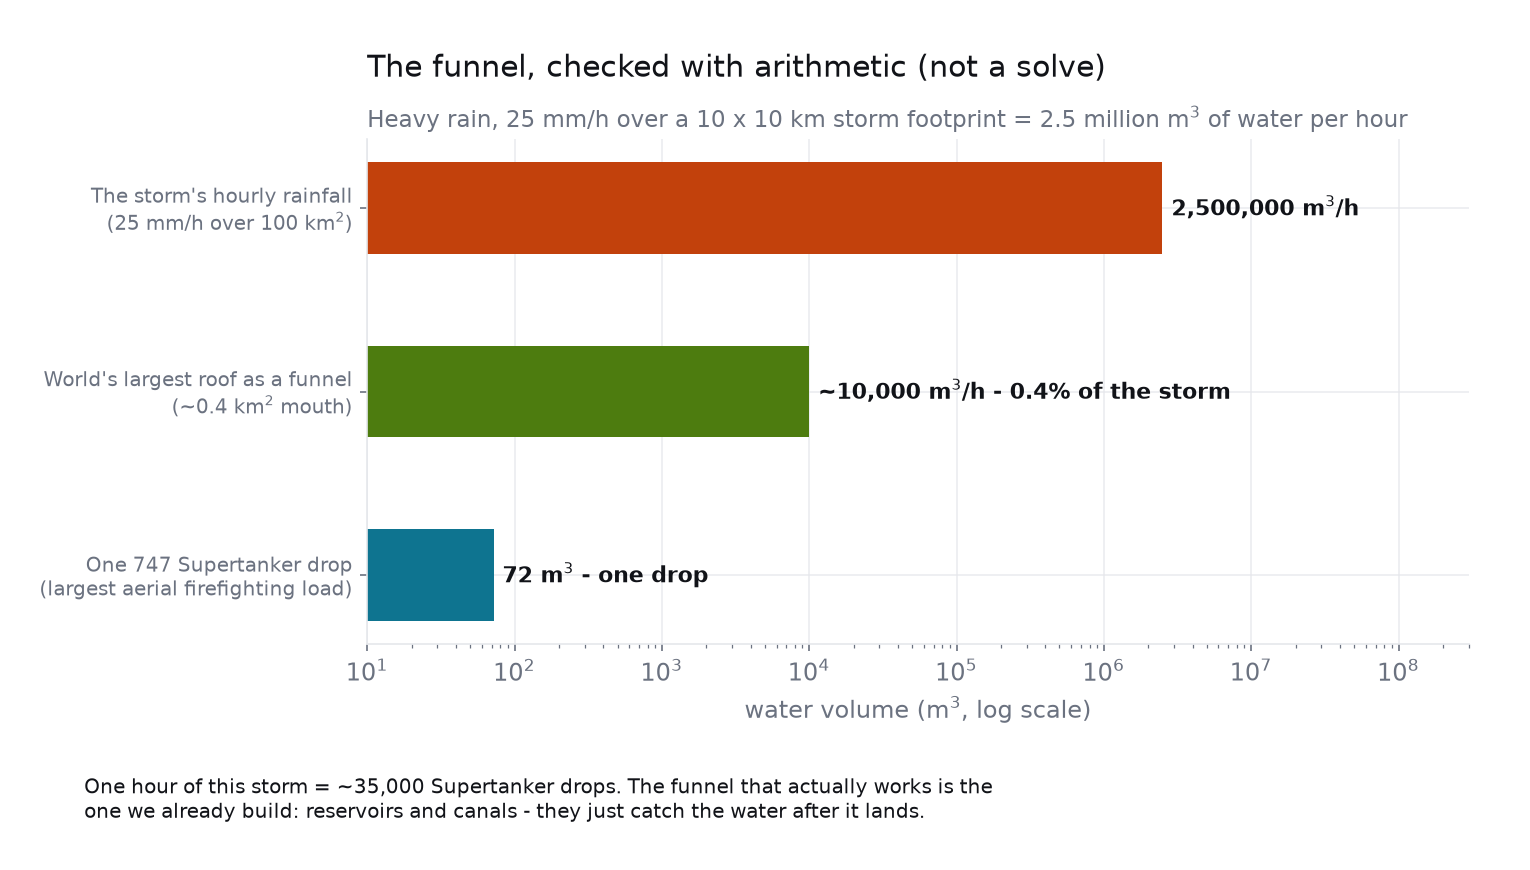
The same scale verdict answers the wildfire hope. A single modest thunderstorm condenses on the order of 500 million kilograms of water — thousands of tanker drops — which is exactly why rain ends fire seasons and aircraft only defend edges. A fan-bent ribbon of drizzle would not register. For completeness: the one technique that genuinely nudges rain is cloud seeding, which works on the cloud’s microphysics rather than its position; the measured literature puts its enhancement between roughly zero and fifteen percent, and it remains contested. We cite it; we did not simulate it.
Locally, a Little; Regionally, No
So: is it possible to redirect rain from a flooding area to a drought area, before it lands? With the biggest fan we could plausibly build, aimed with every advantage physics allows, the solved answer is that you can bend about one percent of a storm’s rain by about a mile, inside a corridor a few hundred meters wide, while consuming a power plant. Meanwhile the atmosphere redirects all of the rain, over the storm’s entire footprint, by kilometers, all the time, for free — and the distances between flooded basins and dry ones are a hundred times larger still. The dream fails not because the fan is weak — six meganewtons is a heroic push — but because the question was always about area, and a jet is a line.
What the exercise leaves behind is better than the daydream: a validated picture of how far any momentum jet reaches into open air (about forty diameters to breeze strength, with the classical decay law as the receipt), a drift chart showing precisely how wind sorts falling rain by drop size, and a set of scale anchors — 98 fans per breeze-face, 4,600 fans inside one storm’s heat engine — that settle the “why not?” permanently. The reservoirs win, and now we can say exactly why.
Wondering what an honest simulation would say about your product’s “what if”? Rand Simulation puts validated CFD and structural analysis behind the questions engineering teams actually argue about — including the ones that start as daydreams. Talk to our team about what Ansys can settle for you — innovation through insight.