Where a Microwave Oven's Hot and Cold Spots Really Are
Everyone has met the two failures of a microwave. The mug of soup that is lava at the rim and cold in the middle. The frozen bite dead in the center of last night's leftovers, ringed by a plate that is already too hot to touch. We are told to let food "stand" and to arrange it in a ring, and we dutifully do, without ever being shown why. The reason is not that the oven is weak or broken. It is that the oven does not fill its cavity with heat at all — it fills it with a standing wave, a fixed pattern of bright and dark spots, and your food heats in that pattern. This study solves that pattern from Maxwell's equations, and then turns the plate to see exactly what the spin can fix and what it provably cannot.
The oven makes a pattern, not a flood
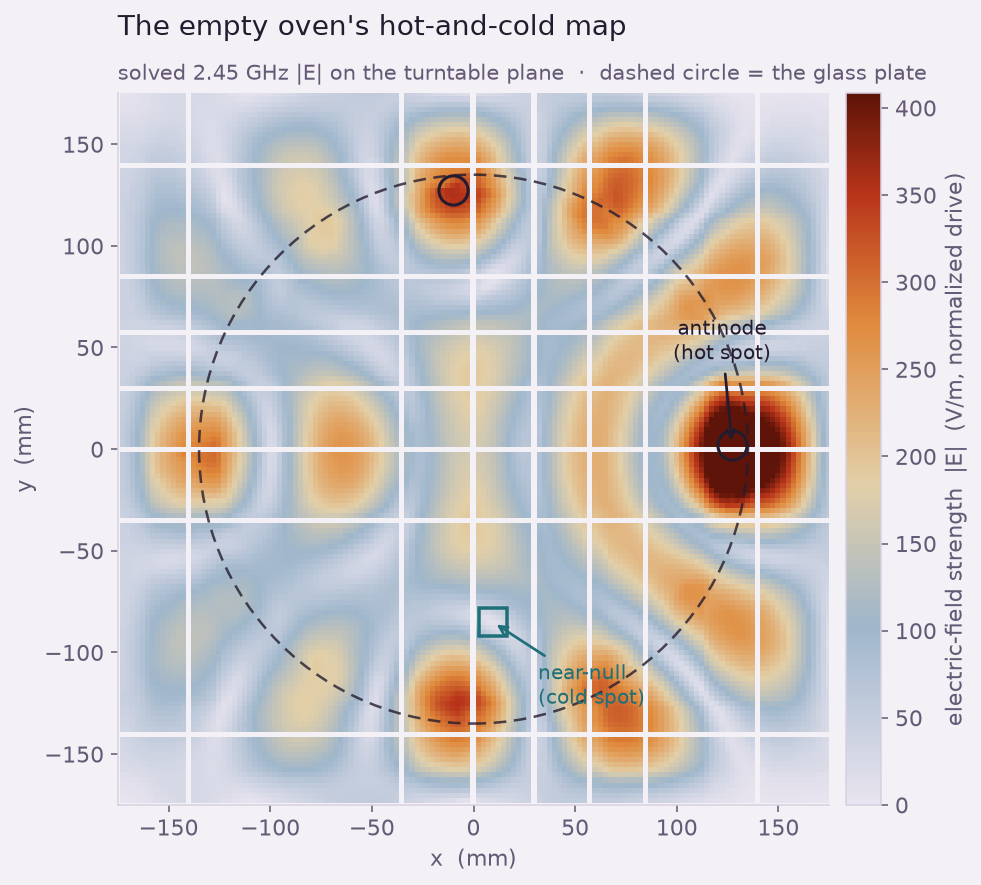
A countertop oven's cavity is a metal box roughly 350 mm on a side. The magnetron drives it at 2.45 GHz, whose free-space wavelength is 122 mm — so the box is only about three wavelengths across in each direction. That is the whole story. A cavity that small does not carry a smooth flood of energy; it rings, like a pipe organ, in a set of resonant modes. For a box this size and frequency there are on the order of a hundred modes crowded near 2.45 GHz, and the real field is their interference sum: a fixed lattice of places where the waves add up (bright antinodes, where food heats fast) and places where they cancel (near-nulls, where it barely heats at all).
We solved that field directly. The cavity is a self-authored, brand-free box with finite-conductivity aluminum walls — real, slightly lossy metal, not a perfect mirror, which is what keeps the resonance from ringing forever and lets the solution converge. Inside sits a borosilicate glass turntable. Ansys HFSS meshes the interior with an adaptive tetrahedral mesh and solves the full-wave field at 2.45 GHz. The result on the turntable plane is below, and it is exactly the picture the folklore implies but never shows: not a warm glow, but a leopard-print of concentrated hot spots separated by cool valleys.
The chocolate-bar test, and a measurement of the speed of light
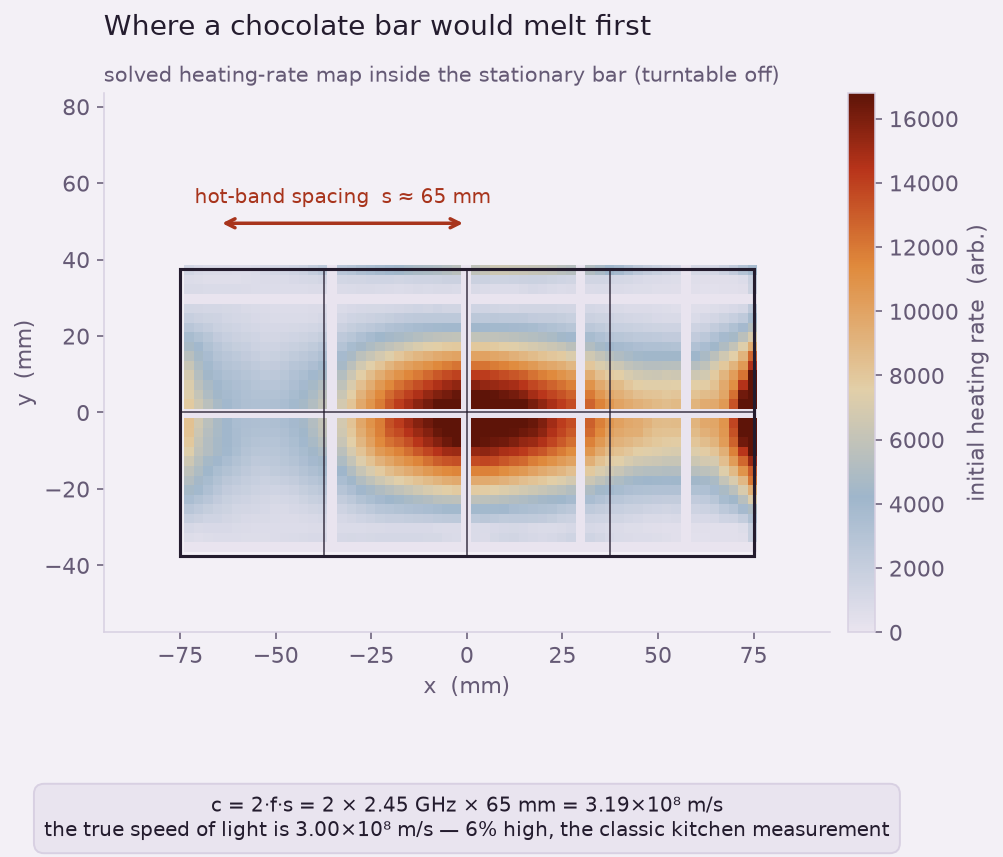
There is a famous kitchen experiment for making this pattern visible: pull the turntable out, lay a chocolate bar flat on the floor of the oven, and run it for a few seconds. It does not melt evenly — it melts in a row of spots, and the distance between those melted spots is half the wavelength of the microwaves. Multiply that spacing by twice the frequency and you have measured the speed of light on your kitchen counter.
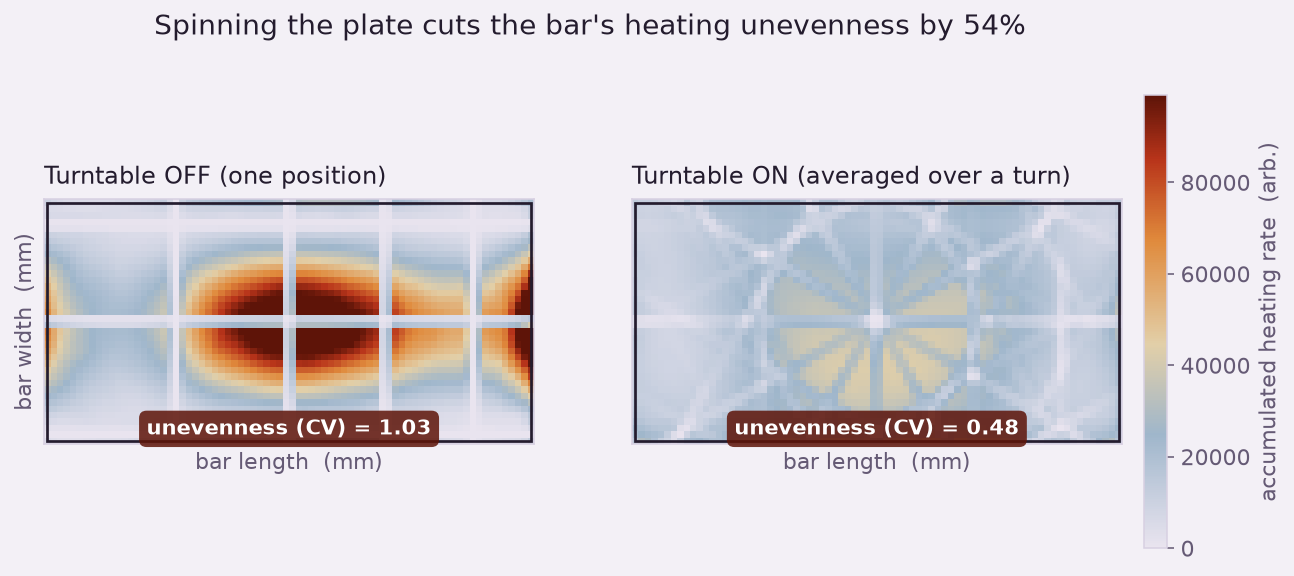
Our solve reproduces it. Food heats by dielectric loss — the heating rate is proportional to the loss factor of the material times the square of the local field — so the initial heating-rate map inside a stationary bar is just the field-squared pattern sampled where the bar sits. The solved map shows the classic bright bands, and their spacing comes out to about 65 mm. Running that through the kitchen formula, c = 2 × f × s, gives 3.19×10⁸ m/s — about 6% above the true 3.00×10⁸ m/s. That is the right kind of agreement to expect and to report honestly: in a real multimode cavity the individual peaks are pushed around by neighboring modes, so the spacing scatters by ten to fifteen percent and the "measurement" lands in the right neighborhood rather than on the nose. The physics is genuine; the precision is a kitchen's worth.
What the turntable actually does
Now turn the plate on. The honest way to model a spinning load is not to slide a frozen pattern under the food — the food is itself a lump of dielectric that perturbs the field, so moving it changes the pattern. We instead re-solved the whole loaded cavity with the bar at six separate angles through a half-turn, and averaged the heating each material point of the bar received over those positions. That is what a parcel of food actually experiences as the plate rotates: it is dragged along a circle through the fixed lab-frame pattern, and its total dose is the average along that circle.
The effect is exactly what the turntable is for. Held still, the bar's heating is wildly uneven — some squares sit on an antinode and cook, their neighbors sit in a valley and barely warm. Averaged over a turn, that unevenness (measured as the coefficient of variation of the dose) drops by about 54%. The hot streaks are smeared into rings, and no single square is left permanently parked on a hot spot. This is a real, quantified benefit, and it is why every countertop oven without a mode stirrer has a turntable.
Why the middle still comes out frozen
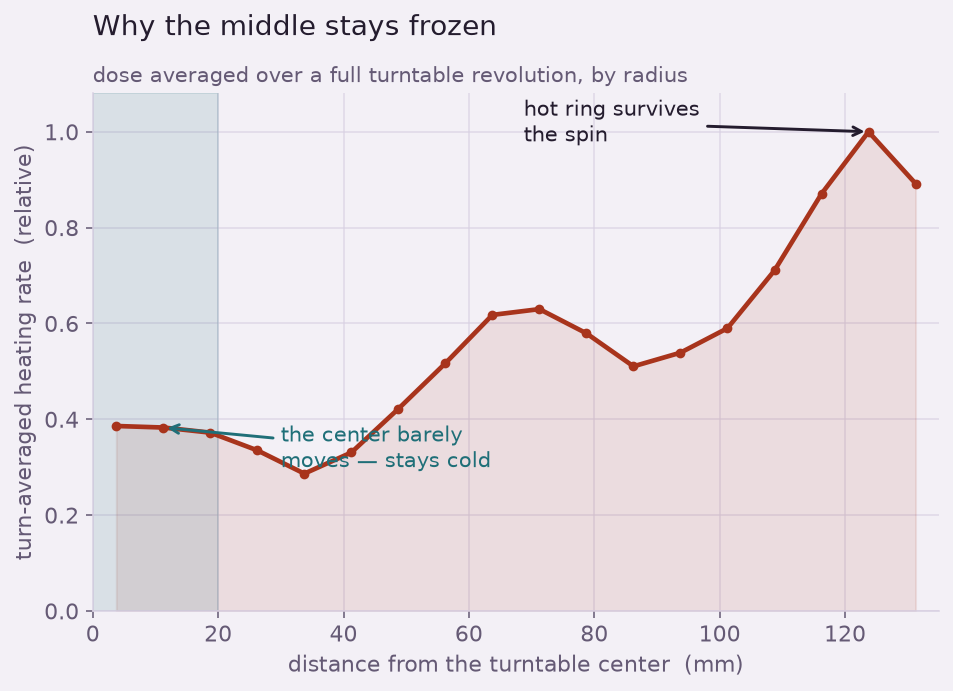
Here is the part the folklore gets wrong. The turntable does not make the heating uniform; it makes it rotationally uniform. Averaging around a circle can only smooth variations that go around the circle — variations in angle. It does nothing to variations that run in and out along the radius, because every point stays on its own circle. A ring of food that lands on a hot radius stays hot; a ring that lands on a cold radius stays cold. And the very center of the plate is the extreme case: it sits on the rotation axis, so it does not move at all. Whatever field the center is sitting in, it sits in it for the entire cook. If that is a null, spinning is powerless to help.
The solved radial profile below shows this directly. Averaged over a full revolution, the dose still has a strong ring structure — and the dead center sits at only about 38% of the hottest outer ring. That is the frozen-center bite, and it is why oven manuals tell you to arrange food in a ring around the edge of the plate rather than piling it in the middle: the edge is where the turntable can do its work, and the center is where it can't.
How we know the field is real
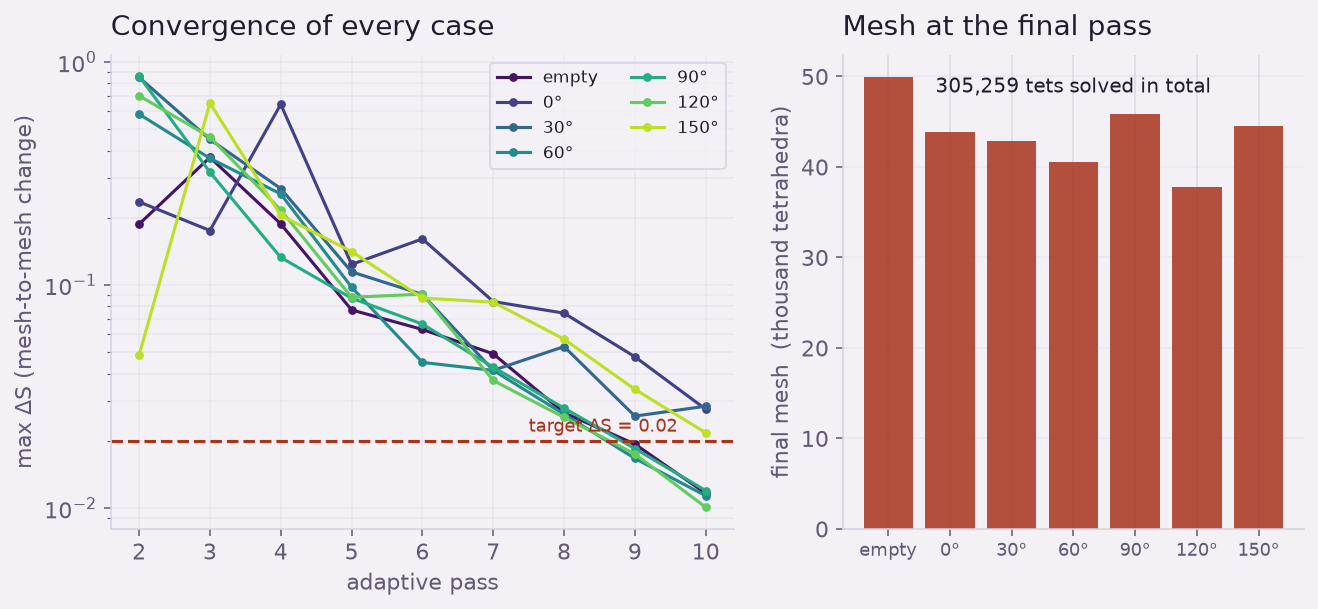
A field solver will always hand you a colorful picture; the question is whether it converged to the right one. HFSS refines its mesh adaptively, pass after pass, and reports how much the solution still changes between passes — the max change in the scattering parameters, ΔS. We ran all seven cases to ten adaptive passes on meshes that grew to roughly 38,000–50,000 tetrahedra each, 305,259 in total. Four of the seven drove ΔS below the strict 0.02 target for two consecutive passes; the other three finished at 0.022–0.029 — a two-to-three-percent residual change in the field between the last passes. For a study whose claims are the shape of the pattern and its statistics — spot spacing, dose variation, the radial profile — that residual is comfortably small, and we report it rather than hiding it. The pattern and its numbers are stable; the last fraction of a percent on an individual peak is not the story.
Is your product's performance riding on a field you can't see — an antenna pattern, an RF heater, a shielded enclosure, a resonant cavity? The same full-wave HFSS workflow that mapped this oven's hot and cold spots from first principles will find where your device concentrates energy, where it leaks, and where it goes quiet, validated against physics you can check. Rand Simulation is an Ansys (Synopsys) Apex Channel Partner, and this study was built end to end by our applications-engineering AI. Let's turn your hardest "why does it do that?" into a picture — that is innovation through insight.