Where a Spillway's Hydraulic Jump Actually Lands
An ogee spillway is one of the best-characterized objects in civil engineering. The crest profile is tabulated, the discharge coefficient has been measured in flumes since the 1940s, and a competent engineer can size the whole thing on one page. So a CFD model of one has to justify itself: if it merely reproduces the page, it has cost you a day and told you nothing. The interesting question is not whether the 1D method is right. It is which of its answers are answers at all.
What the page already tells you
The dam is 15 m high with a 3 m design head, a 55-degree downstream face and a 45 m stilling basin. Before touching a solver we worked the standard chain: the WES ogee profile for the crest, the discharge coefficient correlation for the rating curve, gradually-varied flow down the chute for the depth at the toe, and the Belanger conjugate-depth relation for the jump that has to kill the energy. That is the page. It produced two rating points, two toe velocities and two sequent depths, and it took a few minutes.
It also produced five questions it could not answer, and we wrote them down and committed them before the first solve so that what follows is a prediction being tested rather than a story assembled afterwards. Two of them turned out to be beyond this model as well, and we will say which.
The rating curve holds — on the second attempt at measuring it
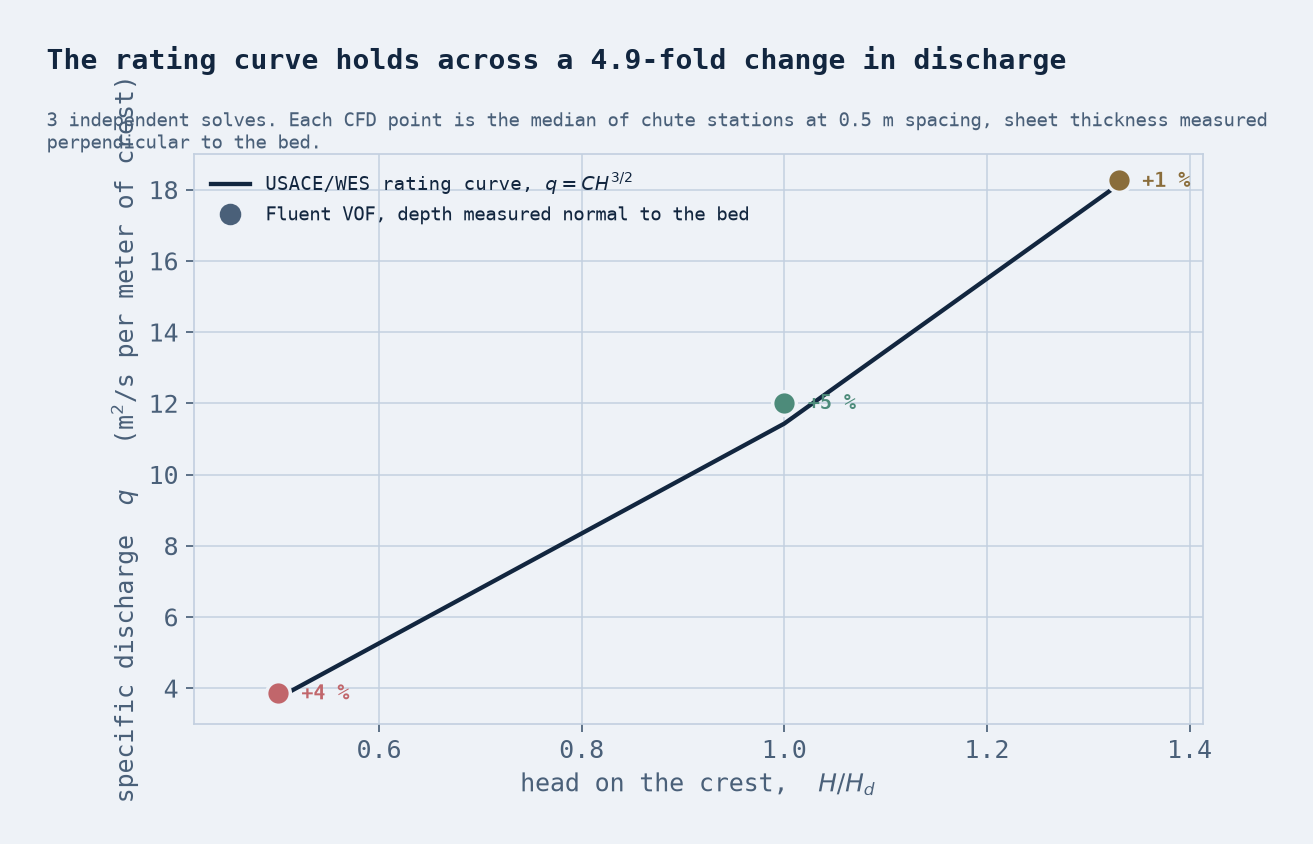
| H/Hd | 1D q (m²/s) | CFD q (m²/s) | error | sheet (m) | jump below toe |
|---|---|---|---|---|---|
| 0.50 | 3.72 | 3.87 | +4.0 % | 0.385 | 10.0 m |
| 1.00 | 11.43 | 12.02 | +5.2 % | 1.040 | 10.5 m |
Agreement inside about 5 % across that range is a real confirmation of the coefficient, and it is worth more than one point would be: the cases span a 3.1-fold change in discharge, so a coefficient that happened to be tuned for one condition would not survive all of them.
Getting there needed the discharge measured in the right place and the right direction, and neither was obvious. Our first estimate took a vertical column of cells in the reservoir and multiplied the mean speed by the depth. It landed within 4 % of the 1D answer, which is exactly the problem — the reservoir is nearly still, so that product is a small number multiplied by a large one, and it agreed by luck rather than by measuring a flux. A discharge has to be measured where the flow is actually going somewhere. On the chute the sheet is thin, fast and unidirectional, and depth times mean speed is the specific discharge.
On a steep chute, depth is perpendicular to the bed
Moving onto the chute introduced the second trap, and this one is worth more than the study. Taking the highest wet cell and subtracting the bed elevation measures a vertical column. On a 55-degree face that over-reads the sheet thickness by 1/cos θ = 1.74 before a single droplet of spray is counted. Feeding that inflated depth into the same flux calculation put the discharge 178 % high. Marching outward along the bed normal instead brought the identical field to 5 %.
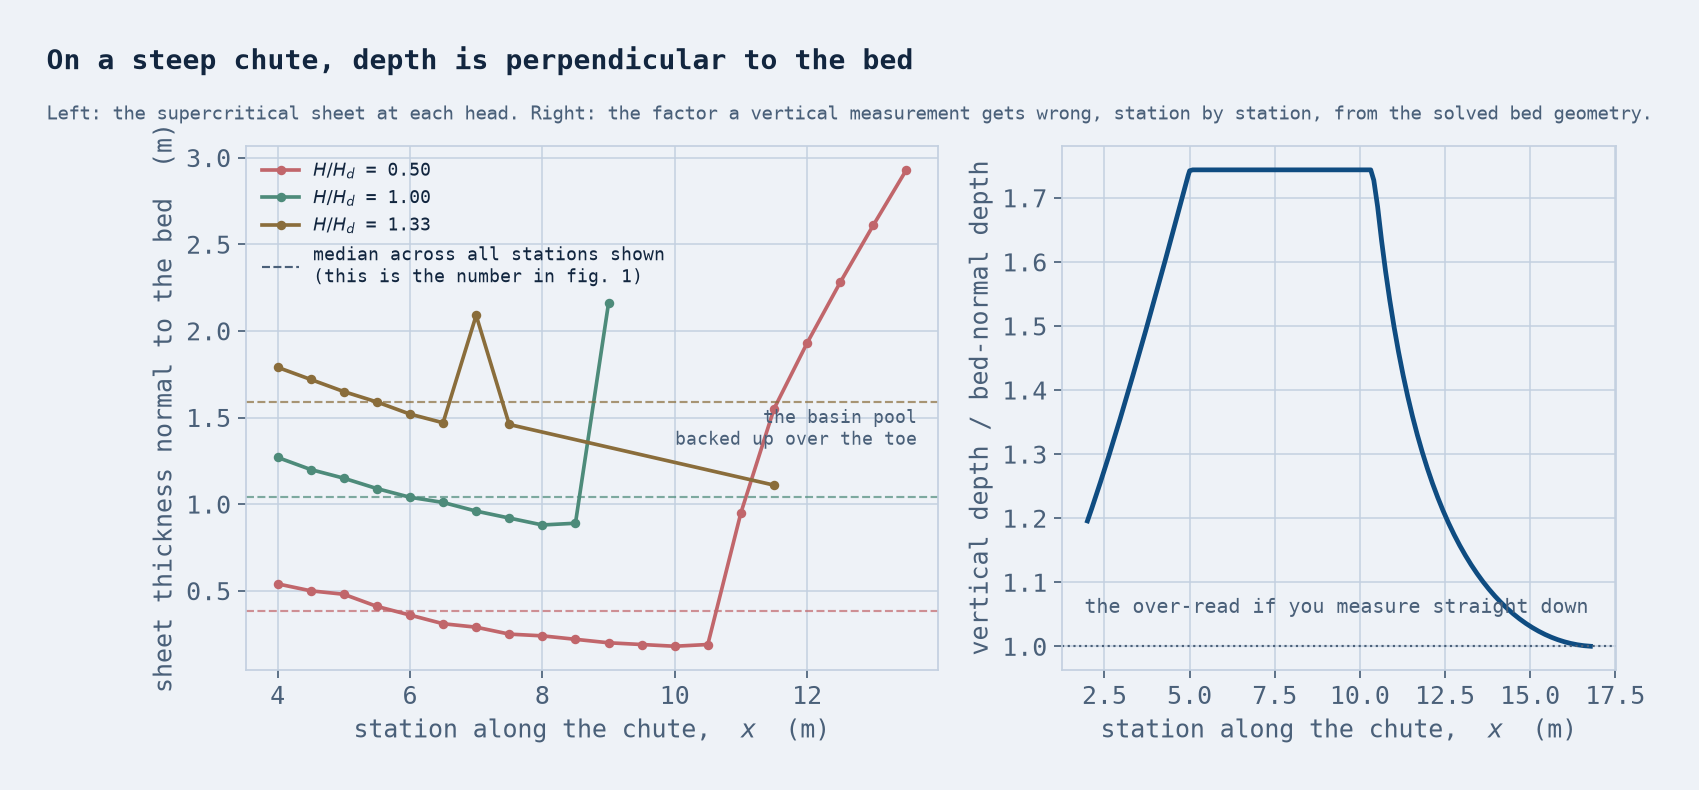
Nothing in the solver output flags this. Every residual converges, the field is physically sensible, and the error lives entirely in the post-processing. It is the same mild-slope assumption the 1D chute calculation already had to abandon, arriving from the other direction — and it is a reminder that on a sloped bed, the measurement has to be bed-normal in the analysis as much as in the model.
Belanger fixes the depth. It cannot say where.
The conjugate-depth relation gives the depth the flow must reach after the jump from the depth and Froude number before it. It contains no length. Ask it where in a 45 m basin the jump will actually form and it has nothing to say — and where the jump sits is what decides whether the basin is long enough, where the floor blocks go, and how much of the apron is exposed to supercritical flow.
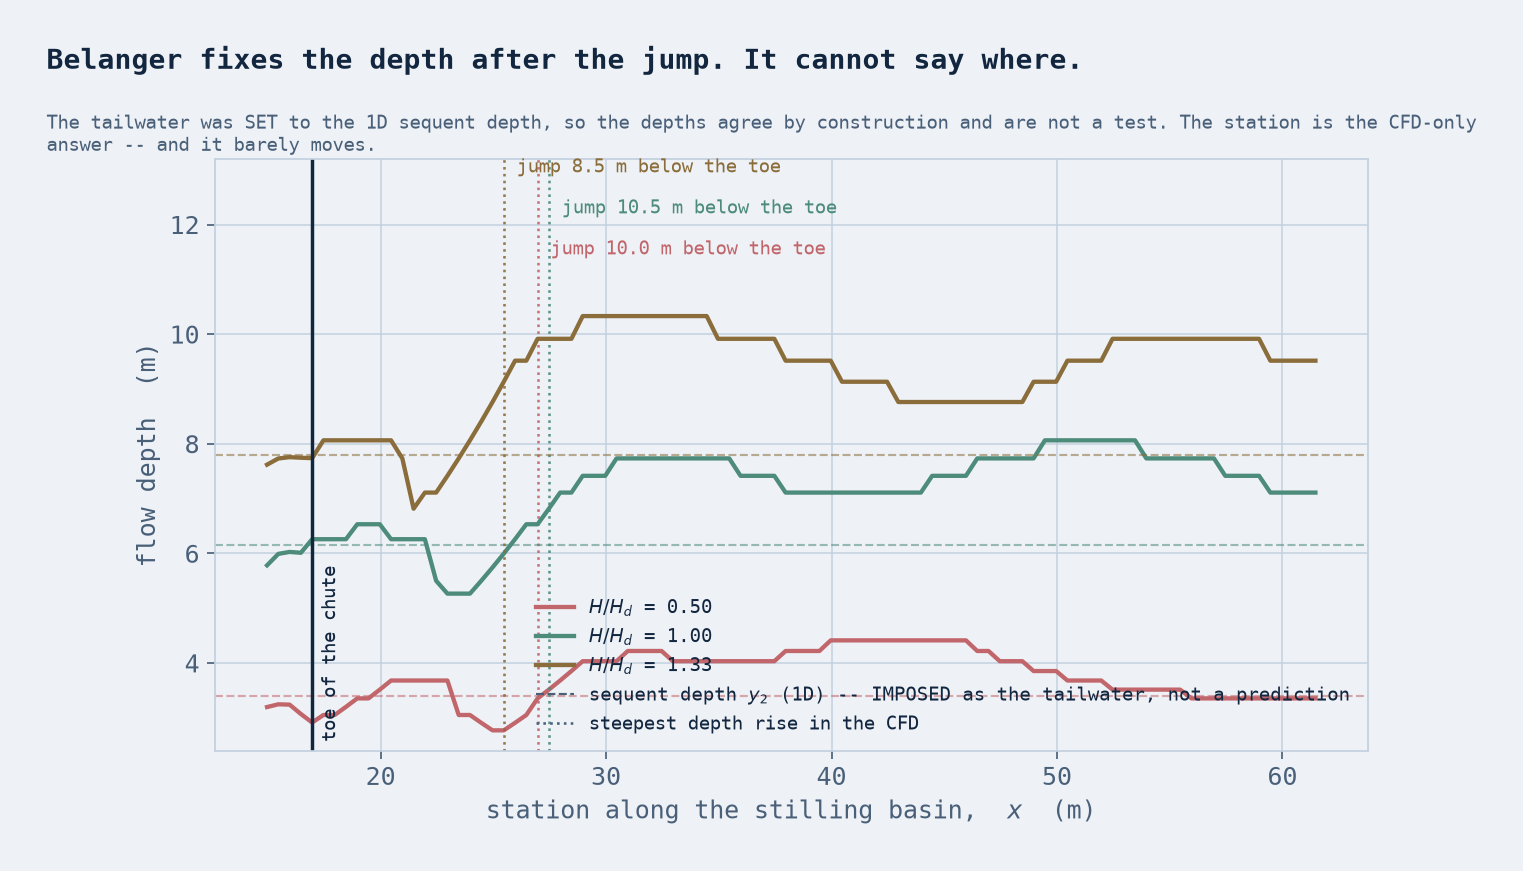
The CFD puts it 10.0 m below the toe at the lowest head and 10.5 m at the highest — a shift of 0.5 m across a 3.1-fold change in discharge. Since the roller itself surges by up to ~1.25 m between frames, that 0.5 m is best read as the mean station being essentially insensitive to head rather than a resolved sub-meter shift. That insensitivity is the useful finding. It is not obvious in advance: the incoming Froude number falls from 10.9 to 7.2 across the same range, the sequent depth more than doubles, and it would be entirely reasonable to expect the jump to walk down the apron as the reservoir rises. It does not.
The number the 1D method cannot give you at all
Scour follows the velocity at the bed. A depth-averaged method has one velocity per station by construction, so it reports the column mean and there is no second number to ask for.
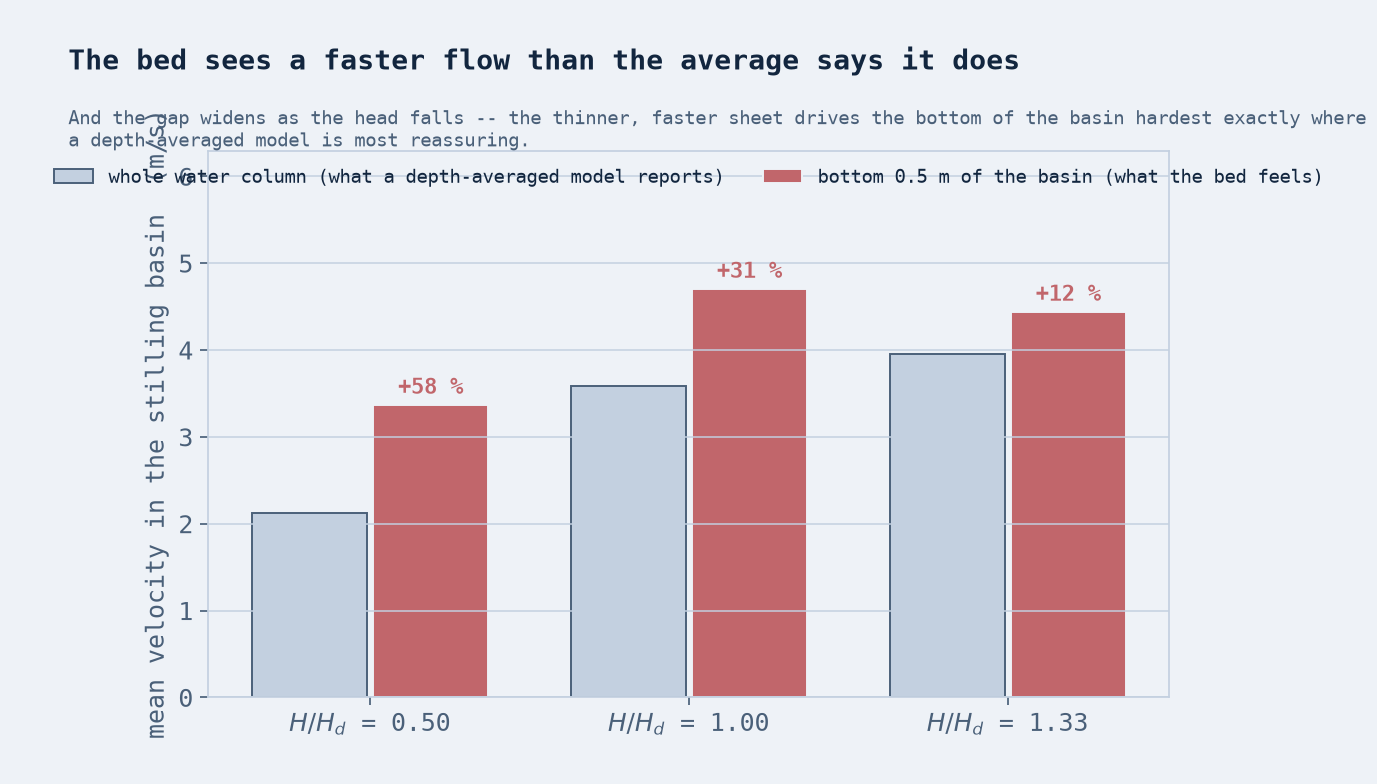
At H/Hd = 0.50 the bottom half-meter of the basin runs at 3.36 m/s against a column mean of 2.13 — +58 %. At H/Hd = 1.00 the bottom half-meter of the basin runs at 4.70 m/s against a column mean of 3.58 — +31 %. The direction of that trend is the part worth carrying away. A thinner, faster sheet arrives at the toe with less water above it to share the momentum, so the fraction of the flow that stays fast and low is higher. The condition where a depth-averaged model is most reassuring — low head, modest discharge, plenty of freeboard — is the condition where it understates the scour driver most.
What this model cannot tell you
Two of the five questions written down beforehand are beyond it, and it is more useful to say so than to answer them badly.
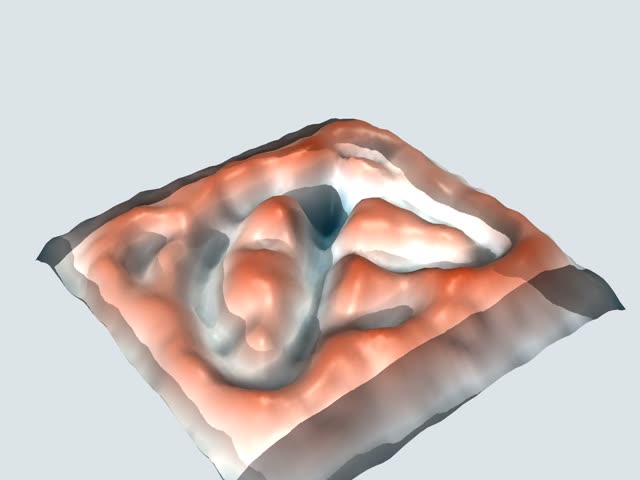
Air entrainment. The 1D work put the inception point — where the turbulent boundary layer reaches the free surface and the sheet begins to self-aerate — past the toe, so this chute is too short to self-aerate on its own account. That is a real result, but it is a hand calculation, not a CFD one. A volume-of-fluid model without an entrainment sub-model cannot represent air being dragged into the sheet, so it cannot confirm or contradict it, and the froth visible in the jump in the hero is interface break-up in a two-phase model, not a measurement of entrained air. Any bulking allowance for freeboard still has to come from the empirical correlations.
Anything across the bay. This is a per-unit-width section. Pier wakes, the contraction at the bay walls, and any spanwise structure in the jump are outside it entirely — and a jump that is stable in section can still be unstable in plan.
Have a structure where the textbook method answers half the question? Spillways, transitions, intakes, culverts, weirs — the closed-form methods are usually right about what they cover, and the design risk sits in what they are silent about: where something forms, what the wall or the floor actually sees, whether a two-dimensional idealization is hiding the failure mode. That gap is what CFD is for, and knowing which half you are buying is most of the value. We do this work in Ansys Fluent and across the Ansys structural, fluids and electromagnetics tools. Rand Simulation — innovation through insight.