
The Color of a Smoky Sky: Ray-Tracing Wildfire Haze from Blue to Blood-Red
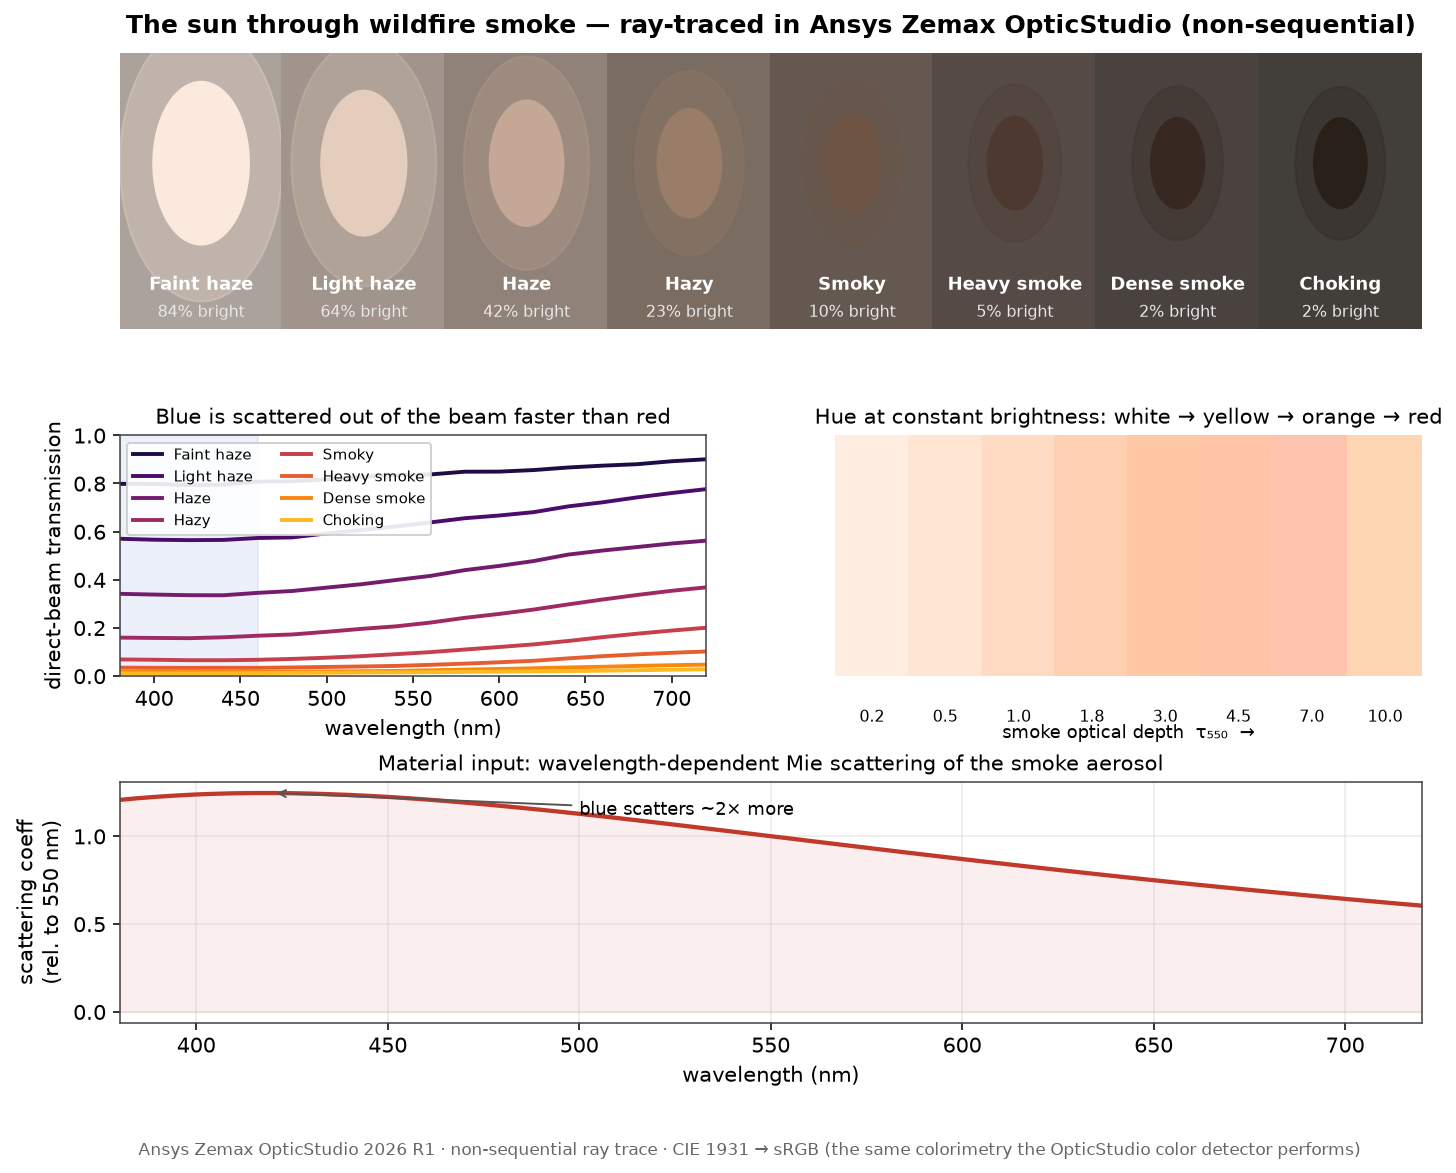
Anyone who has lived through a bad fire season knows the sequence: the sky bleaches from blue to a flat milky white, the sun turns into a dim orange coin you can look straight at, and on the worst days everything glows an eerie red — the “daytime darkness” of San Francisco in September 2020 or New York in June 2023. Spencer asked a great question: can we predict those colors from the amount of smoke in the air? So we built the smoke as an actual optical medium and ray-traced sunlight through it in Ansys Zemax OpticStudio — a non-sequential scattering volume, thickened step by step — and read the color of the surviving sunbeam with the same CIE color math OpticStudio uses to predict how a headlamp or a display will look to a human eye.
Try it: drag the smoke up and down
Slide the PM2.5 control and the scene recolors in real time — sky, sun, and the light falling on the ground — every sun color read straight from the ray trace’s transmission table. Watch the two things happen at once: the sun reddens and fades as its blue is scattered away, while the sky bleaches from blue toward milky white as the leftover scattered light floods in.
How the model works
In Ansys Zemax OpticStudio’s non-sequential mode you build real light sources, real geometry, and real materials, then trace millions of rays as they refract, reflect, and scatter their way through the scene — the tool of choice for designing headlamps, camera systems, and light pipes. We used it in an unusual way: a collimated “sun” beam, a rectangular volume of smoke, and a detector on the far side reading how much light — and which colors — make it through. The smoke volume is given a bulk scattering law: as a ray crosses it, it has a wavelength-dependent chance of being knocked out of the beam. Thicken the smoke and more rays scatter away before they reach the detector; that is exactly what dims and colors the sun.
The one physics input: Mie scattering
Smoke is a cloud of particles roughly 0.1–0.3 micrometers across — comparable to the wavelength of visible light itself — so how strongly it scatters each color is governed by the full Mie theory of scattering by spheres. We solved the Mie equations across the visible band for a realistic wildfire-smoke size distribution and refractive index, and fed that single curve (bottom panel of the figure) into the ray trace as the smoke’s scattering spectrum. The crux is there: smoke scatters blue about twice as strongly as red — much gentler than the sixteen-fold blue preference of clean-air Rayleigh scattering, but more than enough to redden the sun once the column is thick. This is the same kind of measured material input an optical engineer feeds Zemax for a diffuser or a paint; here the “material” is a kilometer of smoky sky, compressed into a benchtop volume with the same optical depth.
Two effects, pulling the color two ways
When you look toward the sun, you see the direct beam that survived — and that is precisely what the Zemax detector measures. Each doubling of smoke scatters more blue than red out of it, so the ray-traced sun marches yellow → orange → deep red and dims: classic Beer–Lambert extinction, here produced ray-by-ray rather than by a formula. When you look at the rest of the sky, you see the light that got scattered toward you — the mirror image of what left the beam. In clean air that scattered light is bluish; as smoke builds it grays and overwhelms the blue, so the sky first goes milky white, and later warms as the sunlight feeding it is itself reddened. That crossover — blue, then white, then orange — is exactly what the widget shows and exactly what people photograph.
From a ray-traced spectrum to a color you can see
The detector hands back a spectrum — brightness versus wavelength — for the surviving beam. To turn that into an actual color we push it through the CIE 1931 standard observer, the internationally agreed model of human color vision, and convert to sRGB with the official matrix and gamma. This is not a bolt-on: it is the very computation an OpticStudio color detector performs to predict how a taillight, a display, or a paint finish will look to a person. So the pipeline is all one optical simulation — trace the light, then see it through a human eye.
Why an engineer cares about the color of the air
The same non-sequential scattering-and-colorimetry workflow runs a surprising amount of real hardware. It is how you design a fog lamp that punches through haze, size the particulate sensor in an air-quality monitor or a smoke detector, predict how a camera and its software will see the world on a smoky day (a real problem for autonomous vehicles and outdoor machine vision), or model glare and veiling through a scattering windshield. And the last step — turning a ray-traced spectrum into a perceived color through the CIE observer — is exactly what optical simulation does for displays, automotive lighting, luminaires, and finishes, predicting the human-visible result before anything is built.
Have a light source, sensor, display, or optical system whose real-world color or visibility you need to predict — through a scattering medium, a lens, or a human eye? The same Ansys optical toolchain — non-sequential ray tracing, then colorimetry to the CIE observer — is how simulation answers “what will this actually look like,” before the first prototype. That’s innovation through insight.