
Can You Actually Run Across a Pool of Oobleck?
You have seen the videos: someone sprints across a kiddie pool of cornstarch-and-water and stays on top, then stops to pose and sinks to their knees. It is one of the best physics-demo clips on the internet. Someone in the Ideas Lab asked the obvious follow-up — is that real, and can we compute it? The honest answer comes in two parts, and the most important part is a caveat: the reason you can run on oobleck is dynamic jamming, and a CFD viscosity model — the tool you would reach for first — fundamentally cannot capture it. So we did not try to force one. We led with the physics that does answer it, and used Fluent for what it is honestly good for here: showing the trend, and showing its own limits.
The physics: why a fast footfall is carried
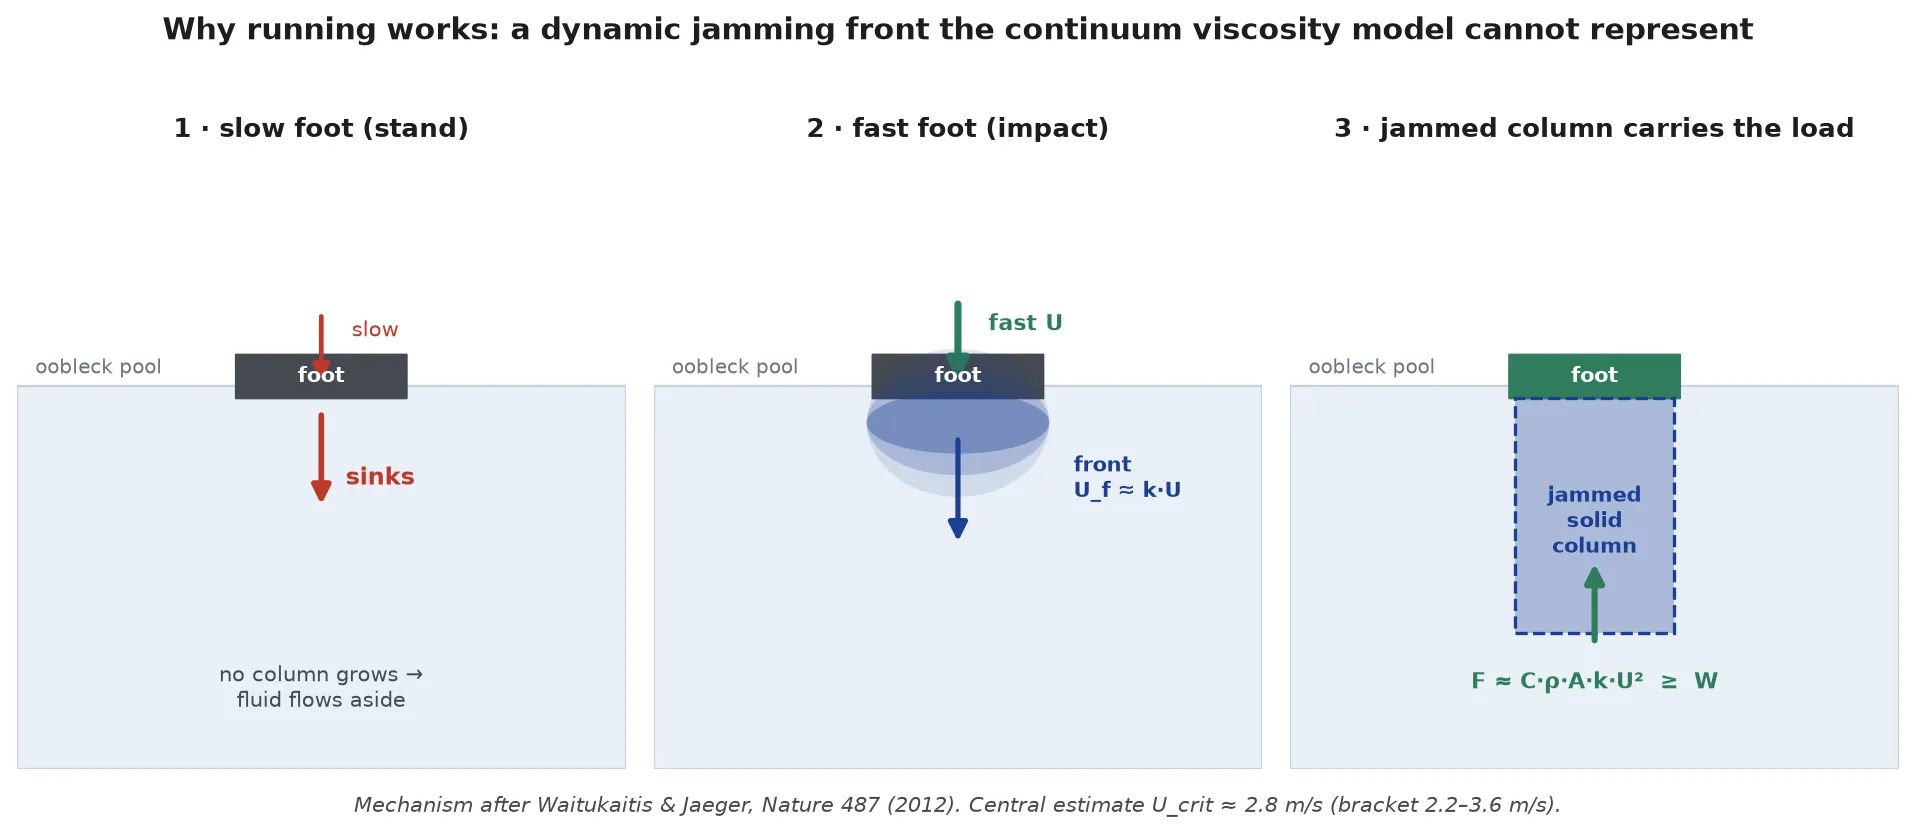
Ordinary shear thickening — a fluid whose viscosity rises with how fast you shear it — is only half the story, and it is the wrong half for standing on the stuff. The decisive mechanism, measured directly by Waitukaitis and Jaeger with high-speed X-rays, is a dynamic jamming front. When you strike the surface, the packing directly under the impact is driven across the jamming transition and a transient solid column grows downward from your foot — and it grows faster than your foot penetrates. The load you feel is the inertia of that growing column of suddenly-solid suspension. It is an impact effect: it exists only while something is decelerating into the surface.
That reframes the question. “Does oobleck support you?” is not about a viscosity value; it is about a critical foot speed. Fast enough, and the jammed column carries your weight before you can sink into it. Too slow — standing — and no column grows, so you sink like it is thick soup. We can put a number on that threshold two independent ways.
Route 1 — added mass of the jammed column. If the front propagates down at speed Uf ≈ k·U (with k a few, from the X-ray measurements), the momentum swept up by the growing column sets the support force, which grows with the square of impact speed:
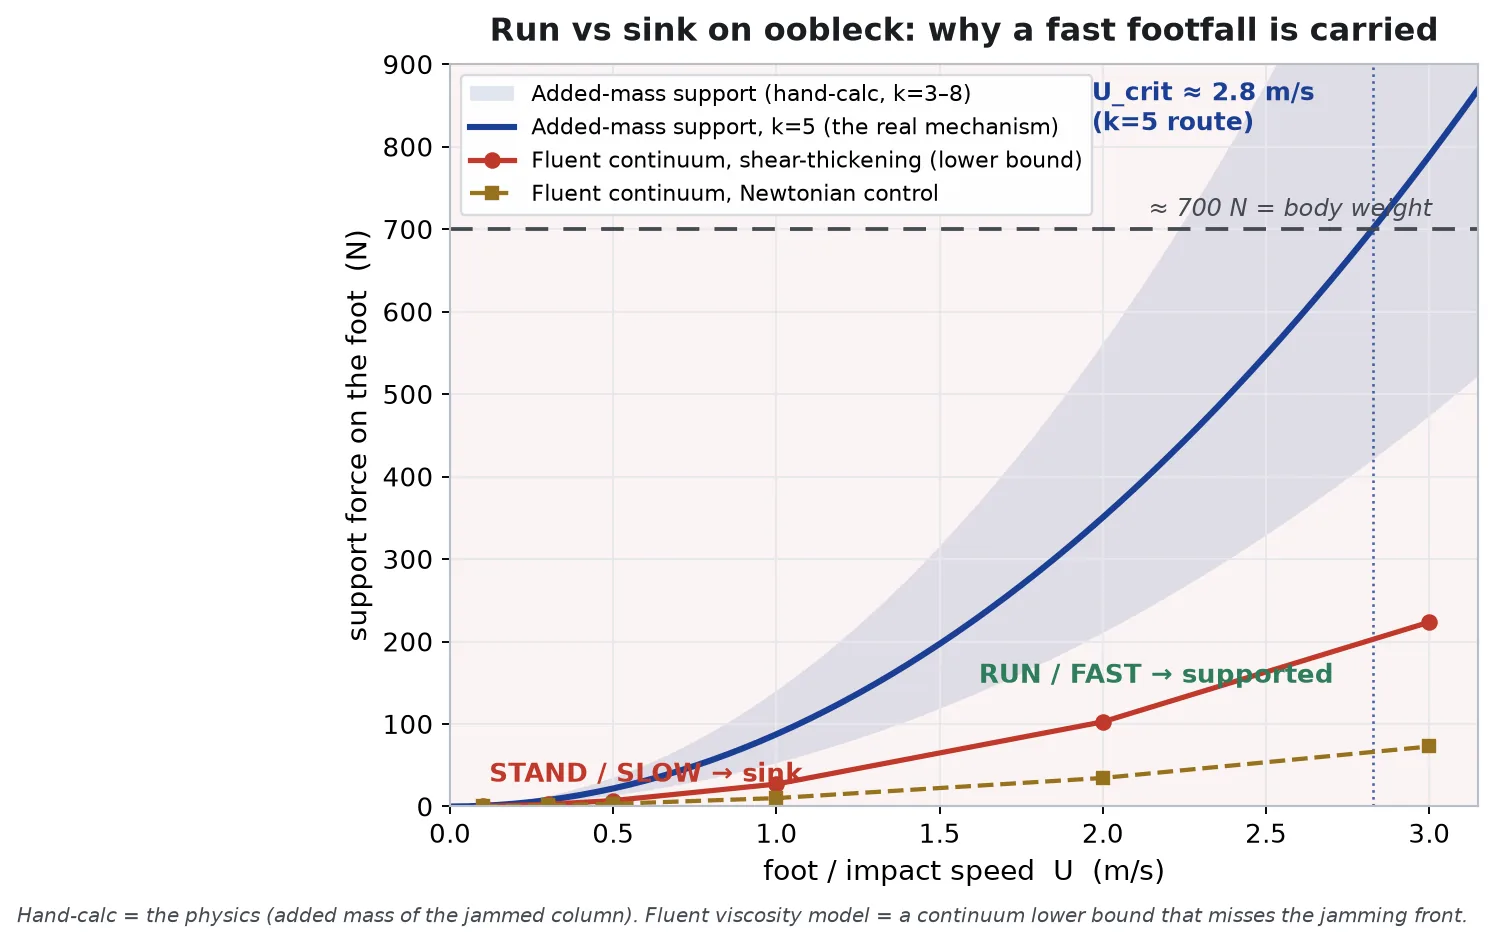
With a foot patch A ≈ 113 cm², suspension density ρ = 1550 kg/m³, one-foot load W ≈ 700 N and k ≈ 5: Ucrit ≈ 2.8 m/s (2.2–3.7 m/s across k = 8–3).
Route 2 — impulse and momentum, as a cross-check. A running foot plants with a downward speed of order 1.5 m/s and has to be arrested over a stance time of about 0.1 s. That takes a force of roughly m·ΔU/Δt = 70 × 1.5 / 0.1 ≈ 1050 N — more than body weight, so the footfall is supported. Standing, ΔU → 0, the force vanishes, and you sink. Both routes land in the same place: a foot moving faster than roughly 2–3 m/s is held; a slow or stationary one is not.
What a CFD viscosity model does — and does not — capture
So why run Fluent at all? Because it cleanly demonstrates both halves of the honest story: the part continuum thickening does reproduce, and the part it misses. We built a 2D-axisymmetric model of a foot-sized disk (radius 6 cm) held in a column of cornstarch suspension and let the suspension flow past it at a chosen speed — the foot’s own reference frame — then integrated the reaction force on the disk. That force is the model’s estimate of the support. Sweeping the speed from a slow stand (0.1 m/s) to a run (3 m/s) traces out how hard the suspension pushes back.
Inside the model
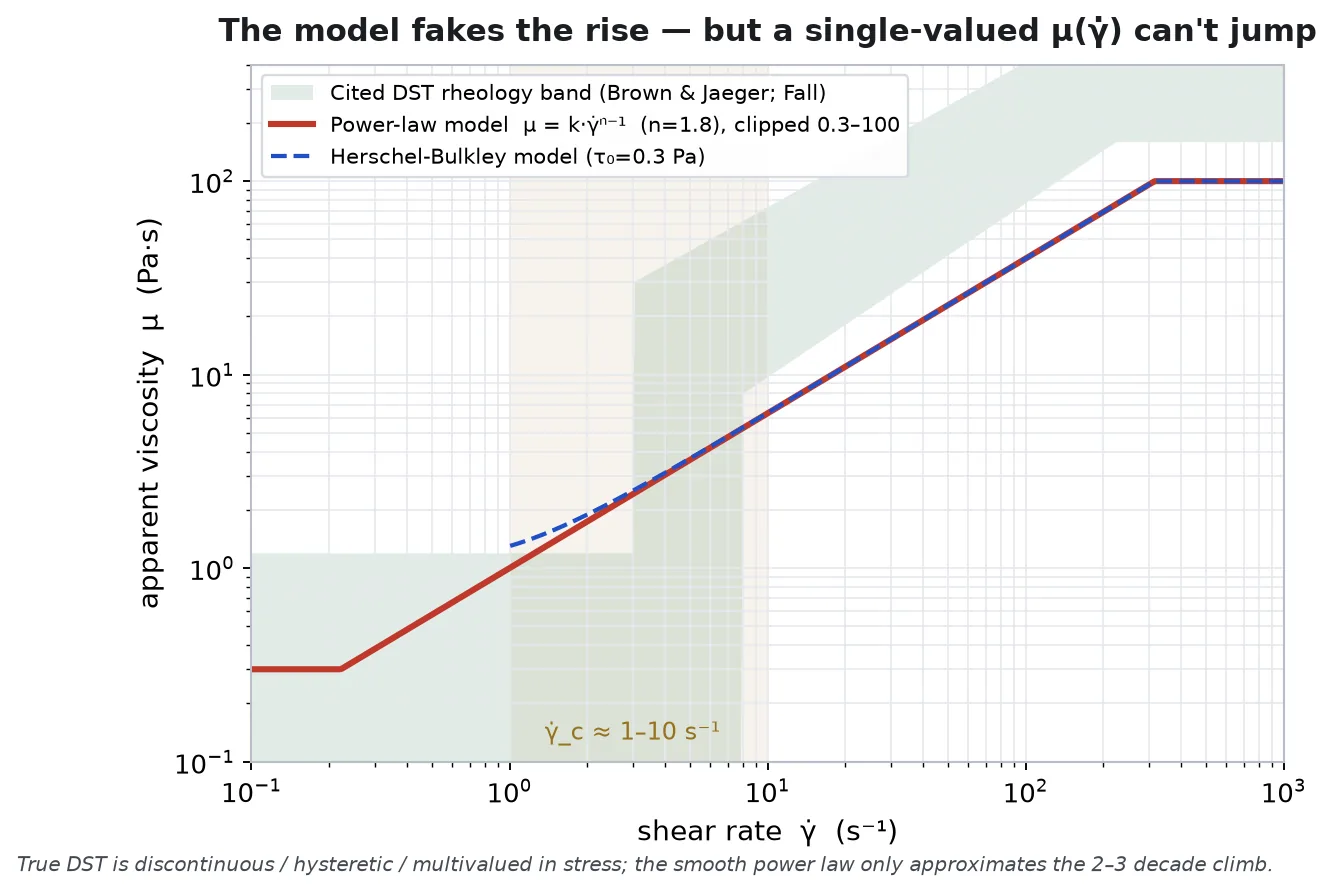
Single phase, laminar, at the suspension’s density of 1550 kg/m³. The rheology is the crux and the caveat: continuum non-Newtonian viscosity laws are all single-valued — one viscosity for each shear rate — so they can only approximate the steep thickening, never the discontinuous jump that real dense-suspension rheology shows. We used a dilatant power law (viscosity rising as shear-rate to the 0.8 power, capped between 0.3 and 100 Pa·s), tuned to climb through the 0.1–100 Pa·s band the cornstarch literature reports (Brown & Jaeger 2014; Fall et al. 2008). The disk face and rim are no-slip walls; the outer boundary is an open farfield. At running speed the thickened Reynolds number is only a few, so the flow is firmly laminar.
The sweep behaves exactly as shear thickening should: the reaction force climbs steeply and super-linearly — roughly as speed to the 1.9 power — from a fraction of a newton at a slow stand to about 100 N at 2 m/s and 224 N at 3 m/s. Against a Newtonian control (a plain fluid at a fixed 1 Pa·s), the thickening case is about 3× larger at running speed, and the ratio grows with speed. That is the CFD getting the qualitative story right: move fast and the suspension fights back much harder.
And here is the honest limit, quantified. At the hand-calc’s critical speed of 2.8 m/s, the continuum model supplies only about 200 N — roughly 28% of the ~700 N a foot must carry. To reach body-weight support it would need about 5.4 m/s, nearly twice the real threshold. The continuum viscosity reproduces the trend and misses the magnitude, because it has no jamming front and no added mass. Reported as a lower bound, that is genuinely useful. Reported as “the CFD says you can run on oobleck,” it would be wrong.
Is it trustworthy? Check the controls
A model result is only worth its controls, and this study leans on three, each cheap and each honest about what it proves:
- A Newtonian control. The same disk sweep at constant viscosity isolates how much of the force rise is the thickening versus plain inertial drag. The thickening adds up to ~3× on top — and it is still not enough to reach the support line, which is the point.
- A model-form check. Re-running one case with a Herschel-Bulkley law (adding a small yield stress) instead of the power law changes the force by 0.14%. The lower-bound result does not depend on which single-valued law we pick to fake the rise.
- A mesh-independence sweep. The support force at 2 m/s moves by only ±0.3% across meshes from 10,800 to 64,400 cells. The number is grid-converged; the offset from reality is modeling (the missing jamming physics), not mesh.
Taken together: the CFD is internally solid and converged, and it still lands a factor of several below the added-mass line. That is not a failure of the solve — it is the solve honestly reporting the ceiling of continuum thinking for this problem. Using the wrong physics gives a visibly wrong magnitude, and seeing exactly how wrong is the most useful thing the model produces.
The verdict
Yes — you can run across a pool of oobleck, and the videos are real. The physics is a dynamic jamming front: a fast footfall (faster than roughly 2–3 m/s) grows a transient solid column that carries you, while standing still grows no column and lets you sink. A continuum CFD viscosity model reproduces the “fight-back-when-fast” trend and is a clean way to see the thickening switch on, but it under-predicts the real support by a wide margin because it cannot represent the jamming. The honest deliverable is the split — the hand-calc for the answer, the CFD for the trend and its own limits — not a single fabricated number.
Round 2: asking the particles directly
When this study went through review, it earned the obvious follow-up: if a continuum viscosity model cannot represent jamming, what can? Jamming is particle physics — grains, contacts, friction, force chains — so round two reaches for the method whose native language is exactly that: the discrete element method (DEM), in Ansys Rocky. In DEM nothing about jamming is prescribed. Every grain is an explicit body, every contact carries normal and friction forces, and if force chains form and stiffen under a fast impact, they form because the contact mechanics made them — the mechanism the continuum model could not draw is the output, not an assumption.
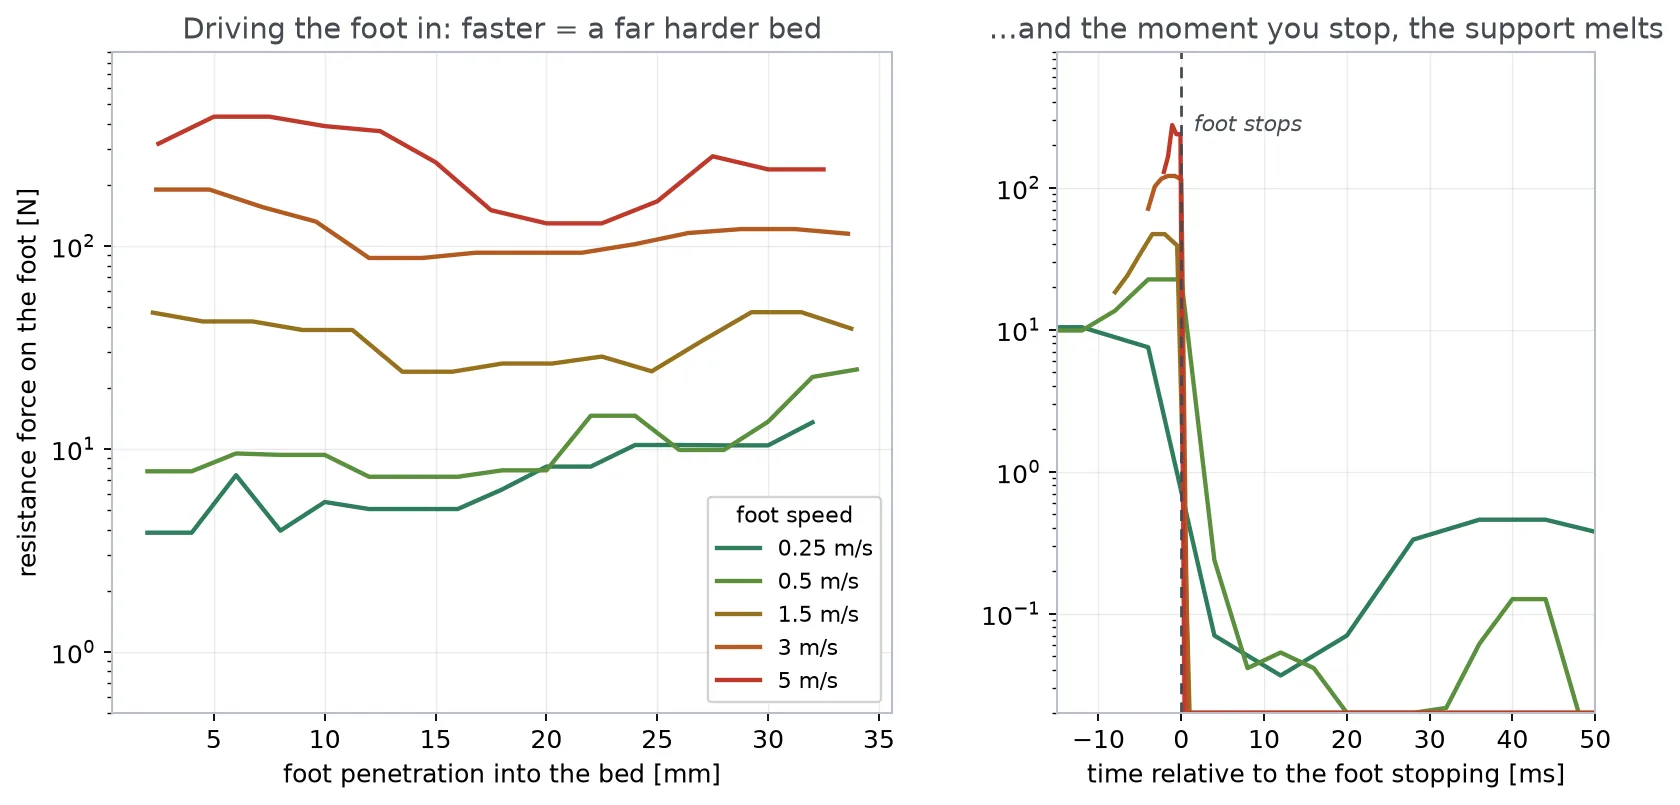
The rig is a deliberately honest bench-top analog, not a pool of oobleck: a settled bed of roughly 7,900 dry spherical grains (6 mm, at the 1,590 kg/m³ particle density of cornstarch) in a 160 mm tank, and a flat-bottomed 48 mm cylindrical “foot” driven straight down through the same 40 mm of bed at speeds from a slow 0.25 m/s push to a 5 m/s strike — then stopped, holding position, to ask the stand-still question too. The resistance force is read directly from the grain-to-foot contact forces.
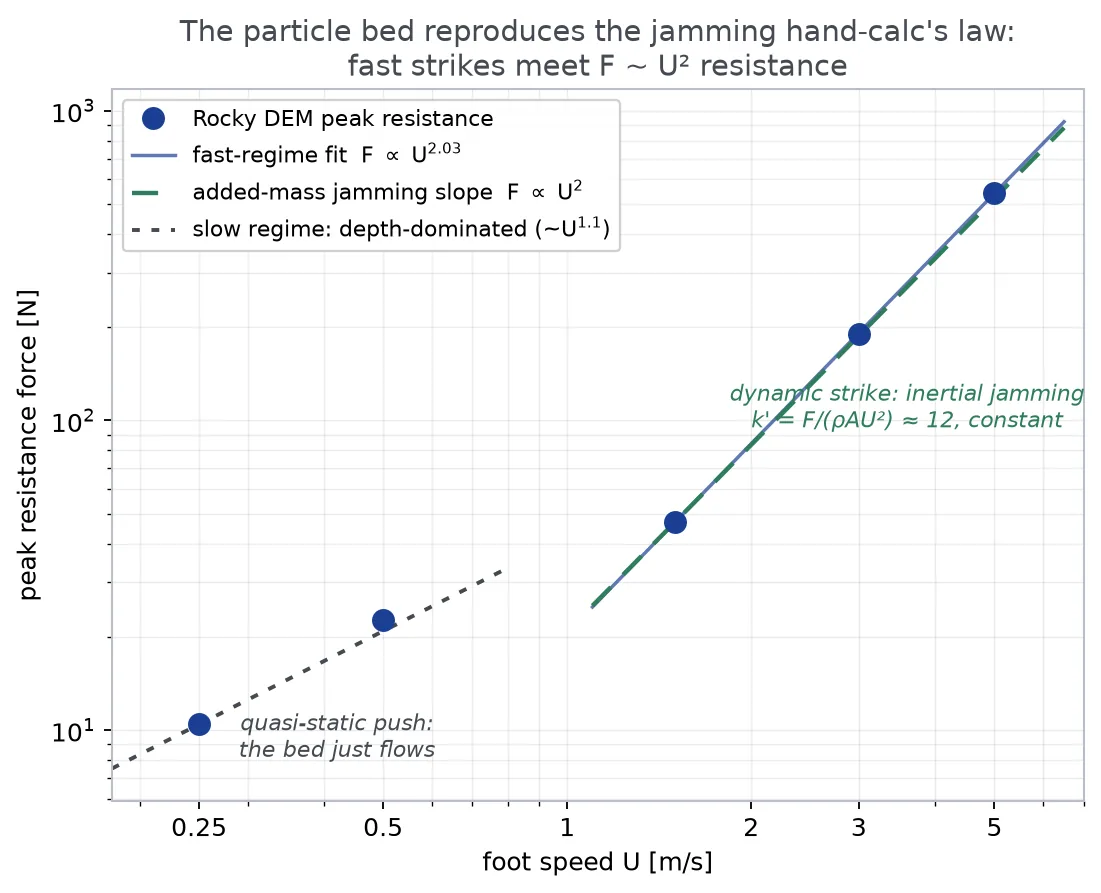
The numbers behave exactly the way the jamming picture demands. Peak resistance climbs from about 10 N for the slow push to about 544 N for the 5 m/s strike — and the shape of that growth is the finding. Below about 0.5 m/s the resistance grows roughly linearly with speed: the quasi-static regime, where force is set by how deep you are, not how fast, and the bed simply flows around the foot. Above about 1.5 m/s the points lock onto a U² law — the fitted exponent is 2.03 — and the dimensionless group F/(ρAU²) sits constant at about 12 across the whole fast regime. That U² scaling is precisely the added-mass / jamming-front form of the round-1 hand-calc, the one anchored to Waitukaitis & Jaeger’s impact measurements — except here nobody put it in. It emerged from grain contacts.
And the run-vs-sink question gets its most direct answer yet from what happens when the motion stops. In every case the foot halts at the same depth and holds — and the support force collapses from hundreds of newtons to a fraction of one within milliseconds. The jammed column is a creature of motion: while the foot drives downward, chains form, stiffen and brace against the floor; the instant it stops, they relax and the bed returns to carrying barely more than the static weight of a few grains. That is the cornstarch-pool experience in one curve — keep moving and the floor is solid; pause to pose and it melts under you.
What this round does and does not claim. This is a dry granular bed — grains a thousand times larger than cornstarch particles, air where the water should be — so it demonstrates the jamming mechanism, not calibrated oobleck rheology. There is no interstitial fluid to lubricate slow flow or couple pressure between grains, the bench-scale rig (48 mm foot, 76 mm bed) is far from a foot in a pool, and contact parameters are standard dry-grain values rather than a fitted suspension model. The natural production extension is to put the fluid back in between the grains — a two-way coupling of the DEM bed with the interstitial liquid (Rocky–Fluent) — which is scoped as the next step in this series.
Have a non-Newtonian, granular, or impact problem where the obvious tool quietly gets the physics wrong? That is exactly the failure mode worth catching before it reaches a design. The discipline we used here — match the mechanism to the method, put a hand-calc control against the CFD, and report the gap instead of hiding it — is how Rand Simulation keeps simulation honest on the problems that matter. Innovation through insight.