
How High Does a Mentos + Diet Coke Geyser Really Go?
Drop a stack of Mentos into a two-liter of Diet Coke and a column of foam rockets out of the neck. Everyone has seen it; the question an engineer asks is how high, and what actually decides that? The popular answer — “the carbonation” — is only half of it. The height is set at two places that have almost nothing to do with each other: the candy’s surface, which decides how fast the foam leaves the bottle, and the air the foam then has to fight on the way up. We modeled both, and the second one is where the folklore breaks down.
Why you can’t just simulate the fizz
The temptation is to model the whole thing in one go — bubbles nucleating on the candy, growing, coalescing, blasting out the neck. That is not tractable: bubble nucleation and growth happen on scales millions of times smaller than the bottle, and there are billions of bubbles. So we split the problem where the physics naturally splits, and we are honest about the seam.
Stage one is a compact degassing model done on paper. A two-liter of Diet Coke holds roughly 5.6 liters of dissolved CO₂ above what stays in solution at one atmosphere. The Mentos surface — a rough, porous dextrose coating — is a spectacular nucleation bed: it converts that dissolved gas into bubbles far faster than the smooth glass ever could. The mechanism, and the candy-vs-candy comparison, trace to the citable reference on this experiment, Coffey (2008, Am. J. Phys. 76, 551). How much of that gas is released fast, and how quickly, is set by the nucleation-site density — and that is the genuinely uncertain knob. So we sweep it: a released fraction of 15%, 30% and 45% of the available gas. Each maps through a foam-column balance to a neck-exit velocity: 4.1, 8.1 and 12.2 m/s. Those three speeds are the entire output of stage one, and the only thing that crosses the seam.
Stage two is the CFD you see above. We take each neck-exit velocity as a boundary condition and let Ansys Fluent propagate the resulting froth jet up into still air, tracking the foam–air interface with VOF. The CFD never sees a bubble; it answers exactly one question — given this efflux at the neck, how high does the jet get?
The result: the ceiling nobody reaches
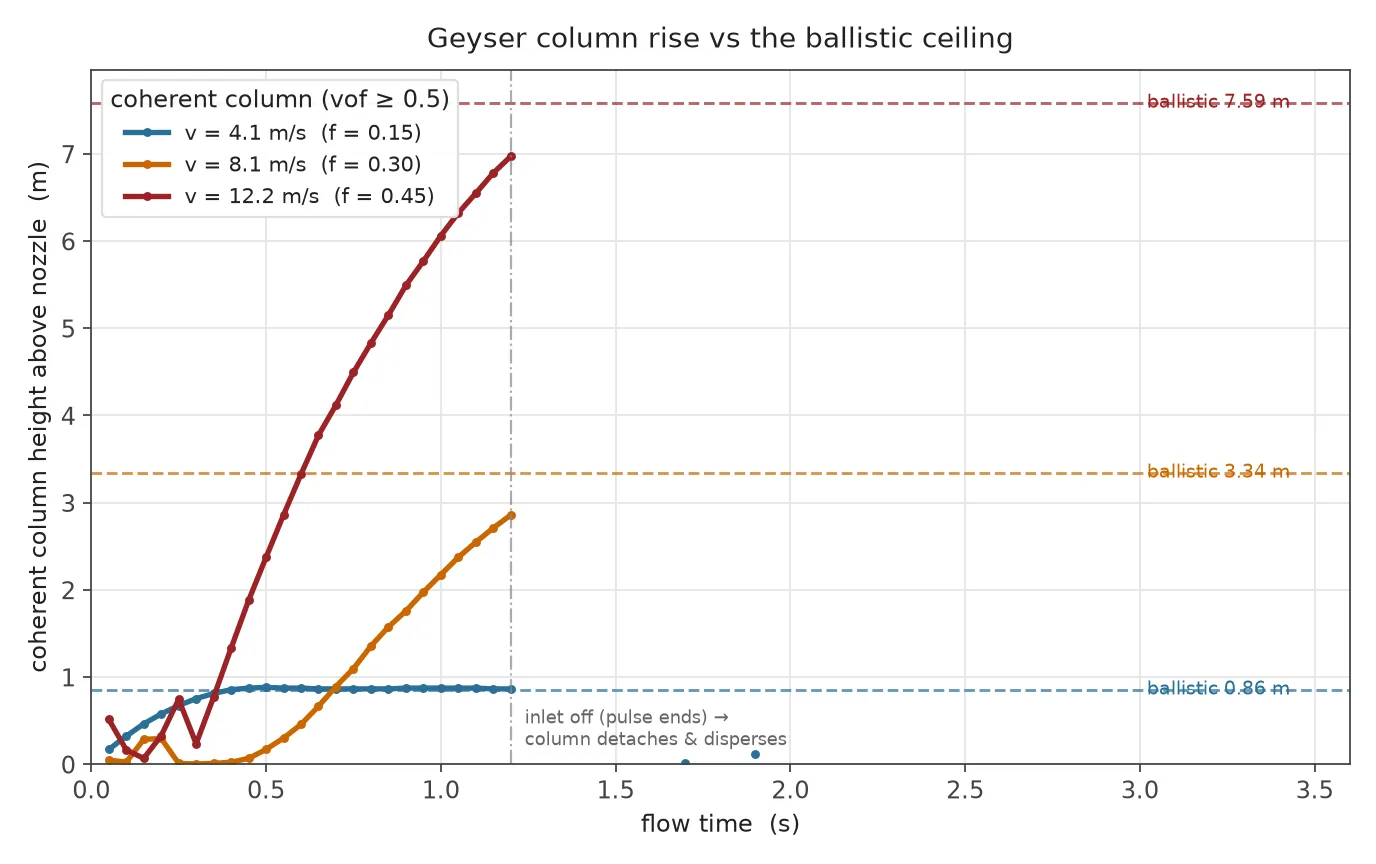
There is a beautifully simple upper bound for how high anything launched upward can go: the ballistic ceiling, h = v²/2g. It is what you get for a single blob thrown straight up at speed v with nothing but gravity acting on it — no air. For our three neck speeds that ceiling is 0.86, 3.34 and 7.59 m. If the geyser were drag-free, that is exactly how high it would go. It is the perfect control, because any shortfall the CFD shows has to come from the physics the ceiling ignores.
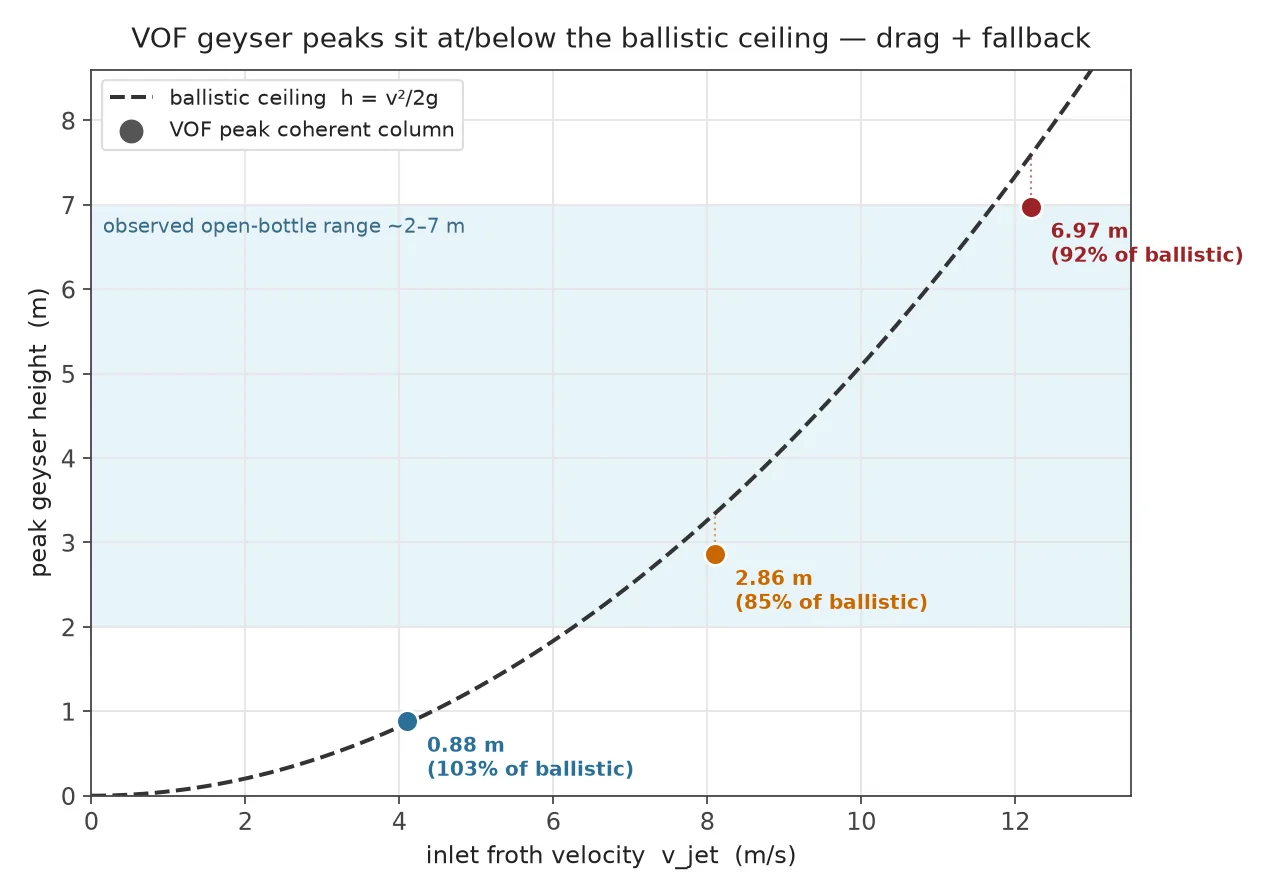
Read the chart from left to right and the story tells itself:
- Weak eruption (4.1 m/s): peak 0.88 m, essentially on the ceiling of 0.86 m. At low speed there is barely any drag to speak of, so the foam very nearly reaches the drag-free height. A fizz, not a fountain.
- Typical eruption (8.1 m/s): peak 2.86 m against a 3.34 m ceiling — about 14% short.
- Vigorous eruption (12.2 m/s): peak 6.97 m against 7.59 m — about 8% short, and right at the top of what people report from an open bottle.
The three peaks — 0.9, 2.9 and 7.0 m — span and bracket the observed 2–7 m range. And the shortfall is not a rounding error: it is drag doing exactly what drag does. Aerodynamic drag grows with the square of speed, so it is negligible for the slow case and takes a real bite out of the fast ones. On top of that, the erupting material is foam — mostly gas, very light — so it has little inertia to push through the air it meets, and once the bottle stops feeding the column, the top of it stalls and rains back down. Drag and fallback, not the chemistry, set the last meter.
Inside the model
The CFD is a 2D-axisymmetric VOF transient in Ansys Fluent: a 9 m-tall, 1.2 m-radius air domain (about 24,750 graded quad cells) with a velocity inlet at the bottle neck, open pressure outlets at the top and side, and gravity along the axis. The erupting foam is carried as a second phase — an effective froth fluid at about 100 kg/m³ (foam is mostly gas; this is an aerated-plume value) — injected as a dense column for the 1.2 s of the eruption, after which the feed is switched off and the column is allowed to fall back, out to 3 s of flow time. We read the geyser height as the top of the foam column that stays connected to the neck (foam volume fraction above one-half for the dense core, above one-tenth for the spray fringe).
Getting a high-density-contrast free surface to solve stably is its own small engineering exercise. A sharp water/air interface at an 800:1 density ratio is numerically punishing for any pressure-based solver; the honest, stable model treats the erupting material as the light foam it actually is, advances the volume fraction with Fluent’s implicit VOF, and runs the pressure–velocity coupling deliberately gently. The foam volume fraction stays cleanly bounded between 0 and 1 for the whole run — the check that the interface is being tracked, not smeared or overshot.
Is it right? Check it against the ceiling and the record book
This study has two independent sanity checks, and it passes both. The first is the ballistic ceiling itself: a correct drag-included solve must come in at or below v²/2g, and ours does, case by case, with the gap widening as drag’s v² scaling predicts. A solve that overshot the ceiling would be telling us the numerics were adding spurious energy; a solve that fell wildly short would point at too much numerical dissipation. Landing just under, by an amount that grows with speed, is the physical signature of drag — the control behaving exactly as a control should. The second check is the real world: open-bottle Mentos geysers are widely reported in the 2–7 m range, and our mid and vigorous cases (2.9 and 7.0 m) land squarely inside it. (The famous multi-story record runs use a purpose-built nozzle to collimate the jet — a different problem, and out of scope here.)
The nice part is what the sweep means. Moving the single uncertain input — how densely the candy nucleates bubbles — walks the geyser across the entire observed range, from a one-meter fizz to a seven-meter fountain. That is the quantitative version of the schoolyard lore that the brand and texture of the candy matters more than the soda. It does, and here is the curve that says by how much.
But where do the bubbles actually come from?
A fair question about any geyser study: where is the fizz itself — the bubbles being born on the candy? In this study, that physics is carried deliberately as a lumped input, not resolved. Diet Coke is supersaturated with dissolved CO₂, and the Mentos coating is a rough, porous dextrose surface studded with microscopic pits and crevices; each pit traps a pocket of gas and acts as a heterogeneous nucleation site, letting bubbles form at supersaturations where the smooth bottle wall produces almost none. That mechanism — surface roughness, not an acid–base reaction — is the established explanation for why Mentos work so well (Coffey 2008, Am. J. Phys. 76, 551). Our stage-one degassing model represents all of it with one number: the nucleation-site density sets how much of the dissolved gas is released fast, and that released fraction maps to the neck-exit velocity the CFD launches. What the study does not resolve is the life of any individual bubble — nucleation at a candy pit, diffusion-driven growth, coalescence, and the two-phase churn inside the bottle neck. The height sweep brackets that uncertainty honestly, but it cannot tell you, for example, how the geyser would change if the candy were etched differently or dropped deeper — questions that live inside the bottle, below our seam.
Next steps in the Ansys tools
Those in-the-bottle questions are exactly the territory Ansys Fluent's deeper multiphase toolset is built for, and each one is a natural next iteration of this model:
- Lagrangian bubbles seeded at the candy surface (DPM). The next iteration adds Fluent's Discrete Phase Model: bubble parcels injected from the candy's surface at a rate set by the measured site density, each tracked with its own drag, buoyancy and growth as it rises through the liquid. That turns our lumped released fraction into a resolved, per-bubble gas delivery into the neck — and lets candy geometry and drop depth become real inputs.
- Bubble size distributions with a Population Balance Model. Fluent's Eulerian multiphase framework couples to a Population Balance Model (discrete or quadrature-method-of-moments) that evolves the full bubble size spectrum — nucleation, growth, coalescence and breakup as source terms. The bubble sizes decide the rise velocity and the interfacial area doing the degassing, so this upgrade replaces our single effective froth with a foam whose texture the solver predicts.
- Dissolved-CO₂ release as real mass transfer. Fluent's interphase species mass transfer models carry dissolved gas as a species in the liquid, with Henry's-law equilibrium at the bubble interfaces driving the release rate — so the supersaturation physics itself, today frozen into our released-fraction sweep, becomes part of the solution. Fluent's degassing boundary condition, built for exactly this kind of bubble-column problem, completes the in-bottle model.
- Sharper jet breakup with refined VOF and VOF-to-DPM. For the airborne column, a finer transient VOF with surface tension and adaptive mesh refinement resolves the surface-tension-driven breakup our coarse cells idealize away, and Fluent's VOF-to-DPM transition then converts the detaching liquid lumps into tracked droplets automatically. That would put a physical spray plume on top of the column — the part of a real geyser this study reports as a band.
Each of these is an established Fluent capability, not a research project — the work is calibration and runtime, which is precisely the kind of staged model-building an engagement plans for. The two-stage study you are reading is the honest first rung of that ladder: it already answers what sets the height; the next rungs move the seam deeper into the bottle.
Have a free-surface, sloshing, jetting, or fill-and-spill problem where “how high / how far / how much spills” is the question? The approach we used here — decide where the physics splits, do the intractable part honestly on paper, solve the tractable part with a validated CFD model, and check it against a bound you can’t argue with — is how simulation turns a messy multiphase question into a number you can stand behind. Innovation through insight.